Figure 1.

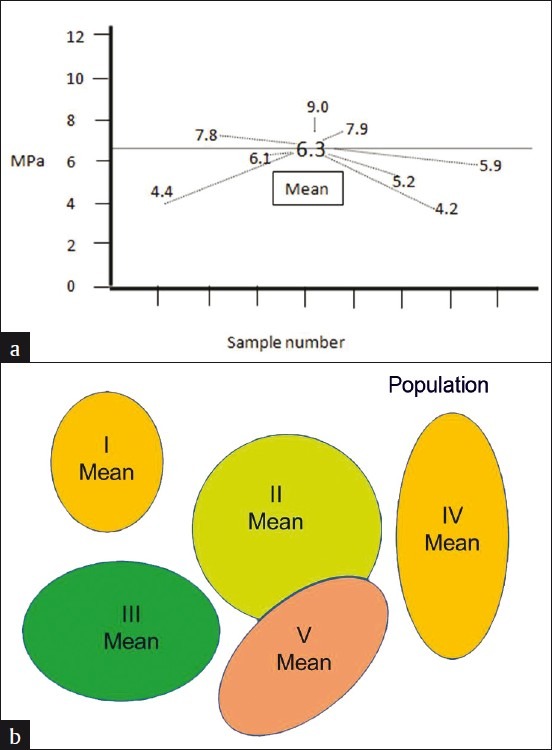
(a) Illustration of shear bond strength values (MPa) of eight samples from a reference population, showing SD, and (b) Repeating the same methodology in different sample sets of the same population, showing SE

(a) Illustration of shear bond strength values (MPa) of eight samples from a reference population, showing SD, and (b) Repeating the same methodology in different sample sets of the same population, showing SE