
Figure 2.
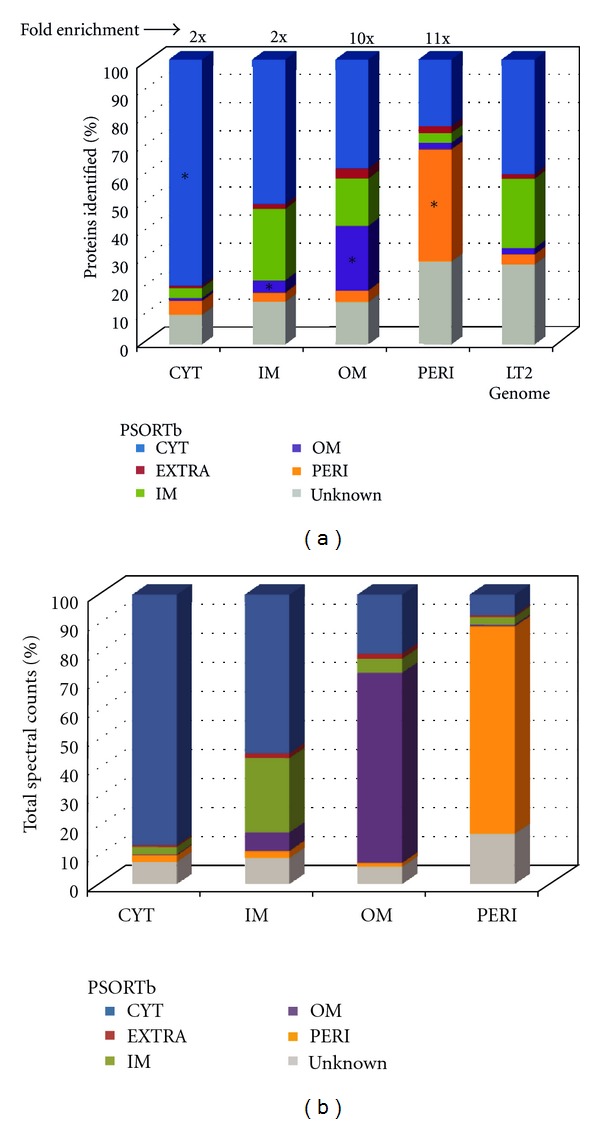
Distribution of proteins observed in subcellular fractions via LC-MS/MS (a). Protein composition of each subcellular fraction, based on number of proteins observed in each fraction sorted according to predicted subcellular location [16]. Data are percentage of proteins observed in each fraction. The fold-enrichment in proteins compared to the genomic potential is noted above each bar. *P ≤ 0.002, χ 2 test, compared to genome (b). Summed spectral counts (total abundance) of proteins observed in subcellular fractions.