
Figure 3.
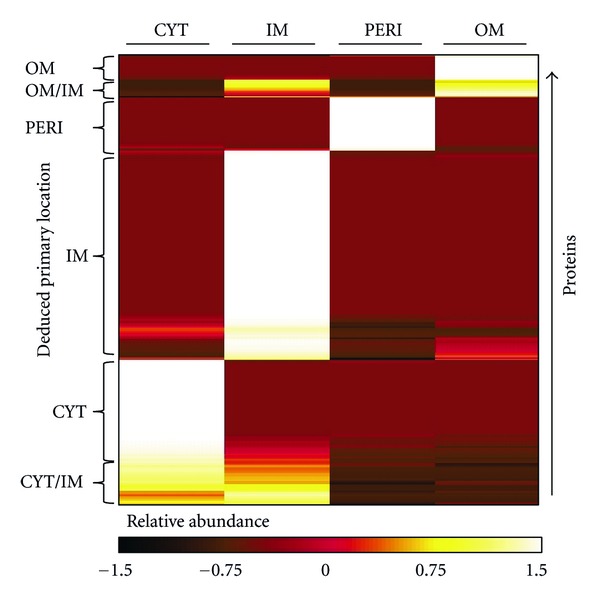
Use of Z-scores and K-means clustering to assign primary subcellular locations to proteins. Since many proteins were observed in two or more subcellular fractions, Z-scores of spectral counts across the four fractions were calculated to highlight the primary observed localization of each protein. K-means clustering was used to group proteins with similar profiles.