
Figure 5.
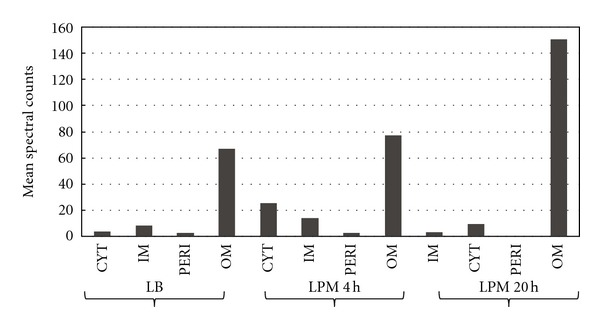
Localization and relative abundance of potential moonlighting protein, Dps. Spectral counts of Dps in each subcellular fraction in each growth condition. Values are means of 3 replicates.
Official websites use .gov
A
.gov website belongs to an official
government organization in the United States.
Secure .gov websites use HTTPS
A lock (
) or https:// means you've safely
connected to the .gov website. Share sensitive
information only on official, secure websites.
Localization and relative abundance of potential moonlighting protein, Dps. Spectral counts of Dps in each subcellular fraction in each growth condition. Values are means of 3 replicates.