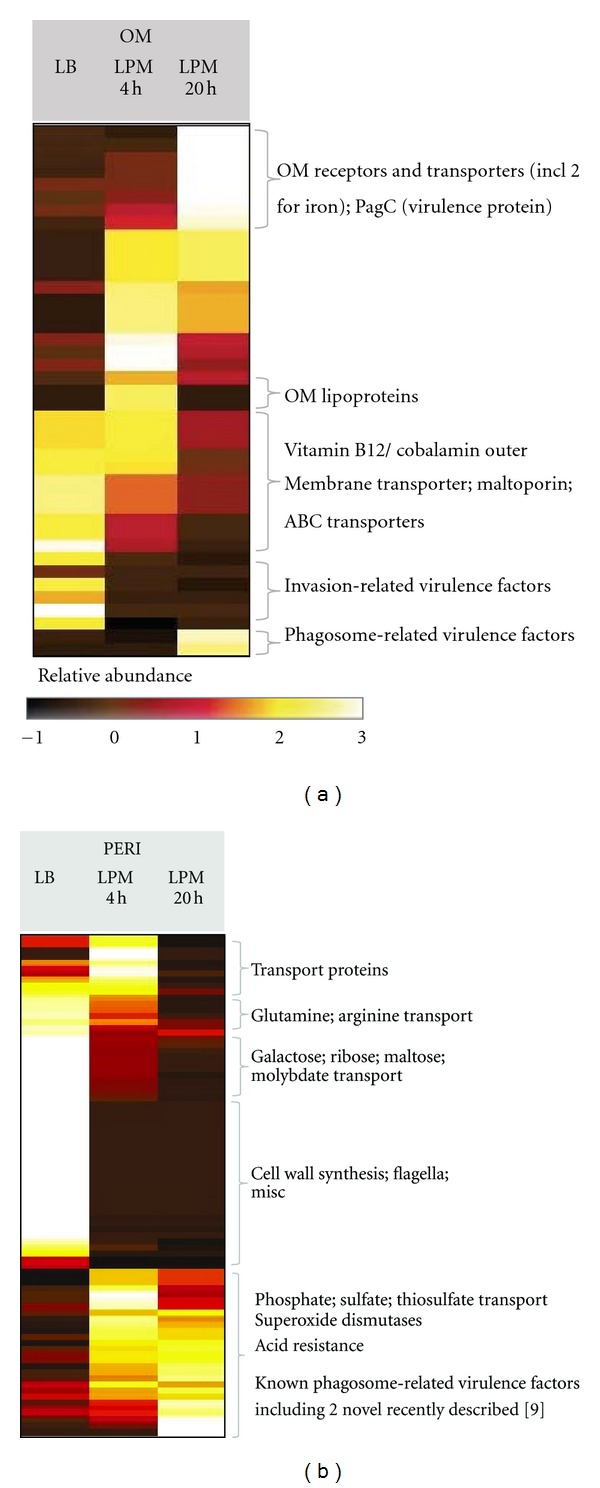
Figure 6.

Heat map representation of differentially expressed OM and PERI proteins. Z-scores of protein abundance were calculated across the 3 growth conditions for proteins observed at their highest levels in the OM (a) and PERI (b) fractions. Each protein showed ≥ 2-fold difference in abundance in any two growth conditions.
