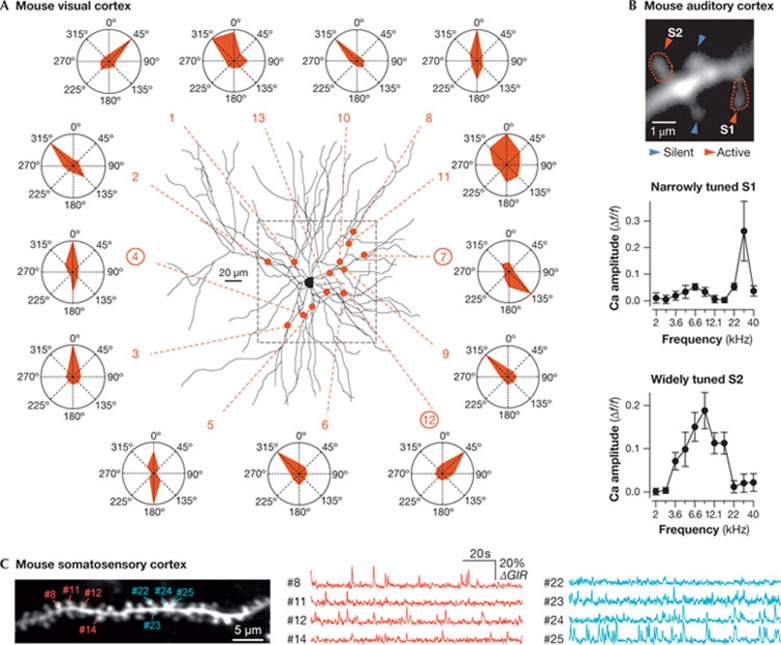
Figure 4.
Imaging spine activity in vivo. (A) In vivo two-photon calcium imaging of synaptic inputs evoked by visual stimulation in a layer 2/3 pyramidal neuron of the mouse visual cortex. Red dots indicate the location of each hotspot of local dendritic calcium signal, on the Z-projection of the reconstructed dendritic tree. Red dashed lines point to the polar plot obtained for the corresponding local dendritic calcium signal. The frame (grey dashed line) indicates the area of imaging. Reprinted by permission from Macmillan Publishers Ltd: Nature [131] © 2010. (B) In vivo two-photon calcium imaging of dendritic spines of a layer 2/3 neuron in the mouse auditory cortex, using the LOTOS procedure. Frequency tuning curves of the narrowly tuned spine S1 and of the widely tuned spine S2, shown in the two-photon image in the left panel. Error bars, s.e.m. Reprinted by permission from Macmillan Publishers Ltd: Nature [82] © 2011. (C) In vivo two-photon calcium imaging of dendritic spines using conventional two-photon imaging. Left panel, a stack image of dendrites of a layer 2/3 pyramidal cell in the mouse somatosensory cortex in vivo. Right panels, typical traces of spontaneous calcium activity from eight spines detected as functionally clustered and indicated in the left panel. Reprinted by permission from the American Association for the Advancement of Science (AAAS) [127]. LOTOS, low-power temporal oversampling.

