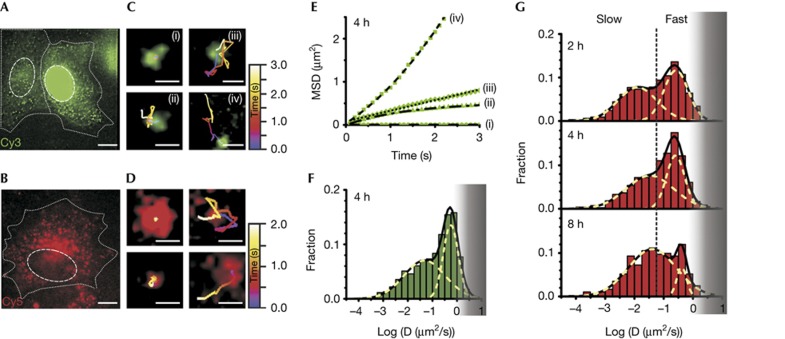
Figure 2.
Single-molecule high-resolution localization and tracking of miRNAs diffusing in living HeLa cells. Pseudo-coloured images of cells microinjected with (A) let-7a-1–Cy3 (left, cytoplasmic injection; right, nuclear injection, supplementary Video 1A online) imaged 4 h after microinjection and (B) let-7a-1–Cy5 (supplementary Video 1B online) imaged 2 h after microinjection, showing distinct particles containing miRNAs. Dashed and dotted lines indicate nuclear and cellular boundaries, respectively. Scale bar, 10 μm. Different types of diffusive motions exhibited by (C) let-7a-1–Cy3 (supplementary Video 2 online) and (D) let-7a-1–Cy5 miRNAs. Scale bars, 0.5 μm. (E) MSD plots of the let-7a-1–Cy3 particles shown in C. Data were fit with equations representing biased (iv), corralled (ii), fast (iii) and very slow (i) Brownian diffusion. Diffusion coefficients as derived from the fits are: D(i)=0.0001 μm2/s; D(ii)=0.06 μm2/s (corral radius=0.52 μm); D(iii)=0.062 μm2/s; and D(iv)=0.16 μm2/s (average velocity=0.46 μm/s). (F) Distribution of diffusion coefficients calculated from individual MSD plots of let-7a-1–Cy3 particles assuming Brownian diffusion (supplementary Methods online). Cells were imaged 4 h after microinjection (n=4 cells, supplementary Table S1 online). The grey shaded region represents diffusion coefficients of particles that are increasingly lost due to our limited time resolution of tracking. (G) Distribution of diffusion coefficients of let-7a-1–Cy5 at different time points after microinjection. Dotted lines represent demarcations of fast and slow particles to guide the eye, estimated based on segregation of the two Gaussian distributions 2 h after microinjection. Histograms represent data from multiple cells (n=4, 4 and 6 cells for data points corresponding to 2, 4 and 8 h, respectively, supplementary Table S1 online). Grey shaded region, as in F. MSD, mean squared displacement; miRNA, microRNA.

