Figure 4.
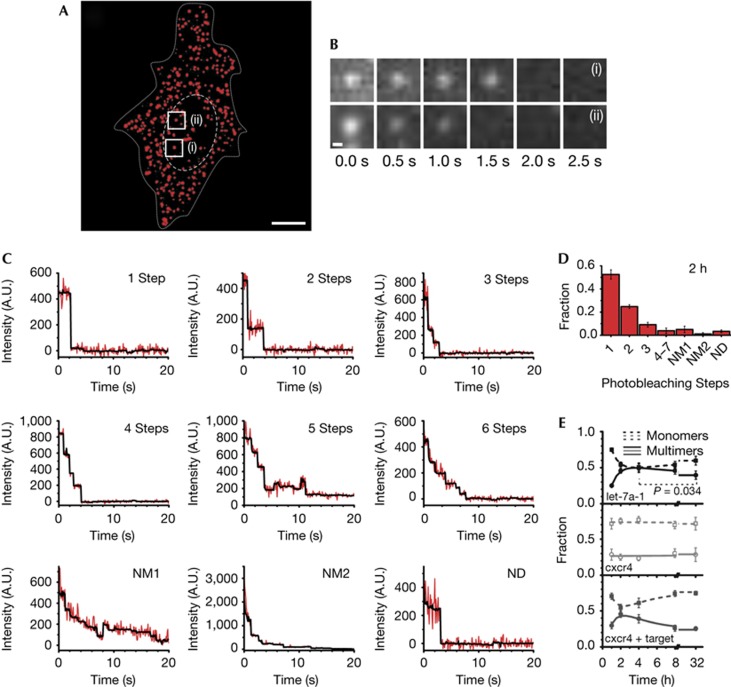
Counting of single miRNA molecules in fixed HeLa cells. (A) A pseudo-coloured (background corrected) image of a formaldehyde-fixed HeLa cell (supplementary Video 4 online) showing the intracellular distribution of miRNAs 2 h after microinjection. Dashed and dotted lines indicate nuclear and cellular boundaries, respectively. Scale bar, 10 μm. (B) Sets of frames showing photobleaching of two different miRNA particles over the indicated time. The locations of the particles are labelled in A. Scale bar, 300 nm. (C) Representative stepwise photobleaching traces of individual miRNA particles within the cell shown in A. For some traces, the number of steps could not accurately be determined. These traces were further classified as either non-determinable multimer with indistinct steps (NM1); non-determinable multimer with initial peak intensity exceeding that expected from up to 7 fluorophores based on an average intensity of ∼250 arbitrary units (A.U.) per fluorophore bleaching step (NM2); or non-determinable as either monomer or multimer due to large fluctuations in intensity and rapid (<3 frames) photobleaching (ND). (D) Distribution of miRNA photobleaching steps observed 2 h after microinjection (n=4, supplementary Table S1 online). Error bars, s.d. (E) Change in the fraction of monomers (particles undergoing a single step of photobleaching, dotted line) and multimers (particles that bleach in two or more steps, solid line) over time for let-7a-1 (black), cxcr4 (grey) and cxcr4 miRNAs comicroinjected with specific mRNA targets (dark grey, supplementary Fig S7A,B online), respectively. Each data point is derived from multiple cells (nlet-7a-1=4, 4, 3, 4, 8 cells; ncxcr4=5, 5, 5, 7, 9 cells; and ncxcr4+mRNA=4, 4, 4, 6 and 8 for 1, 2, 4, 8 and 32 h, respectively; supplementary Table S1 online). Error bars, s.d. The relative changes marked by asterisk are statistically significant with greater than 95% confidence, based on a paired t-test (P=0.034). miRNA, microRNA.

