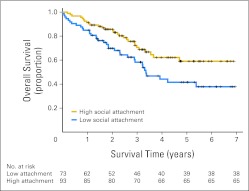
Fig 2.
Survival time for patients with high social attachment (Social Provisions Scale attachment subscale ≥ 15) versus patients with low social attachment (score < 15). Cox regression adjusted for covariates indicates that patients with higher social attachment had longer survival times (P = .018). Numbers of at-risk (still alive) patients in the low versus high attachment groups are indicated below the x-axis.

