
Fig. 2.
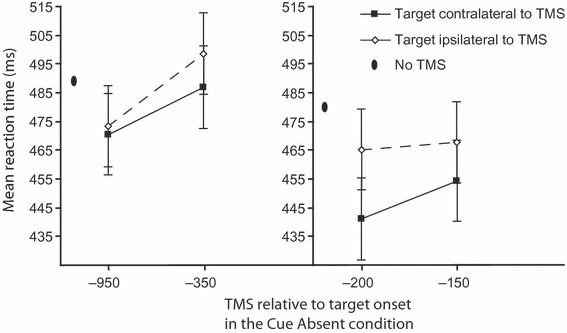
Mean reaction times in the cue-absent condition as a function of TMS timing relative to target onset for the long trials session (left panel) and the short trials session (right panel). Solid lines depict the mean reaction time when the target was presented in the visual field contralateral to TMS and dotted lines depict the mean reaction time when the target was presented in the visual field ipsilateral to TMS. Error bars represent normalized standard errors (Loftus & Masson, 1994). For each session, the mean reaction time in the no TMS condition is depicted as an oval.