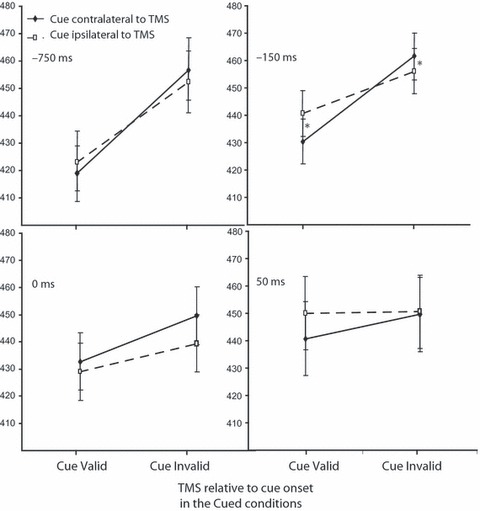
Fig. 3.

Mean reaction times for each different TMS timing relative to cue onset as a function of cue validity. Filled diamonds with solid lines depict mean reaction time when the cue was presented in the visual field contralateral to TMS, and open squares with dashed lines when the cue was presented in the visual field ipsilateral to TMS. Error bars represent normalized standard errors (Loftus & Masson, 1994). The asterisks at −150 ms before cue onset indicate significant differences between contralateral and ipsilateral TMS relative to cue presentation for the valid and invalid condition.
