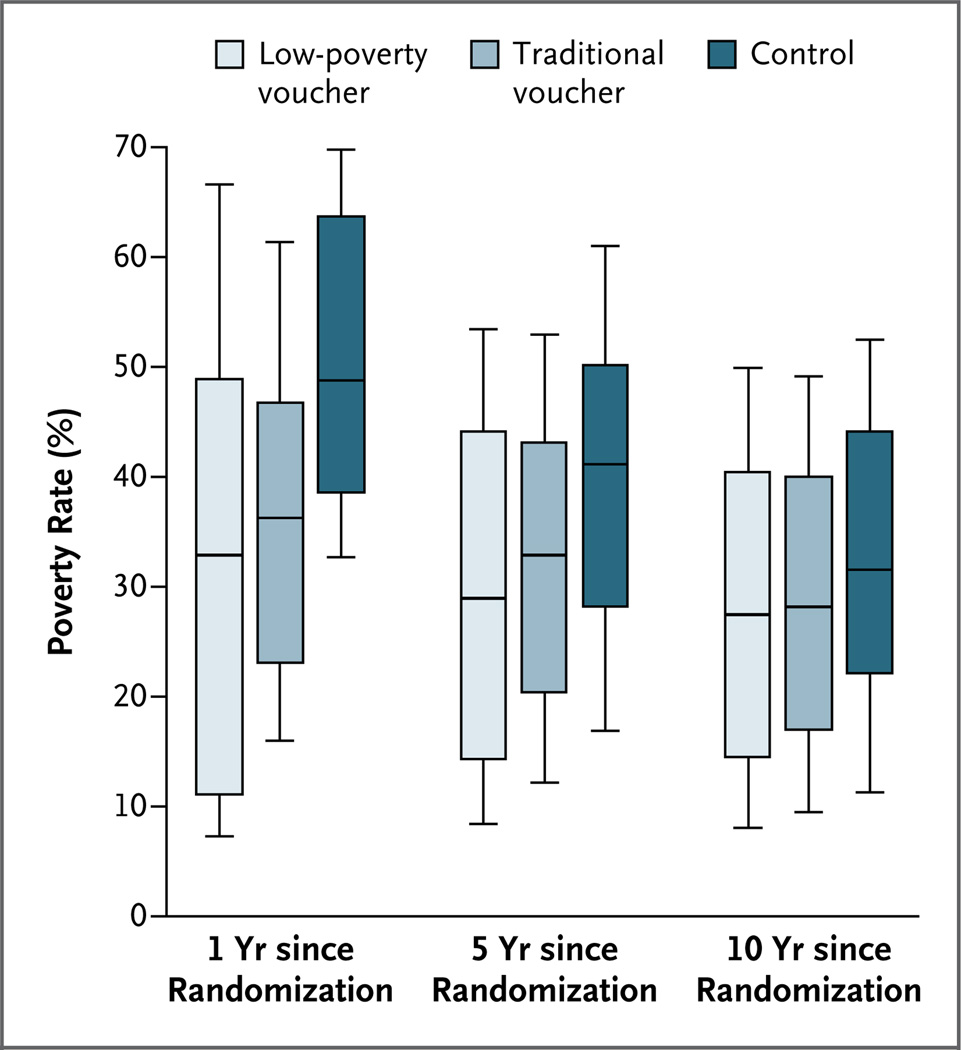
Figure 2. Census-Tract Poverty Rate According to Study Group and Years since Randomization.
The horizontal line in the middle of each vertical bar indicates the median of the census-tract poverty rates within each randomly assigned group, the upper and lower boundaries of each bar mark the 75th and 25th percentiles, and the I bars (whiskers) mark the 90th and 10th percentiles. Census tracts are small geographic areas that usually contain between 2500 and 8000 people and were defined by the Census Bureau to correspond to local communities that have relatively homogeneous population characteristics. The censustract poverty rate for families in the study 1, 5, or 10 years after randomization was linearly interpolated from data in the 1990 and 2000 decennial censuses and the American Community Survey for 2005 through 2009. The sample includes 3026 women for whom there was a valid measure of body-mass index or a valid measure of the glycated hemoglobin level in addition to valid addresses at baseline and at the three time points shown.

