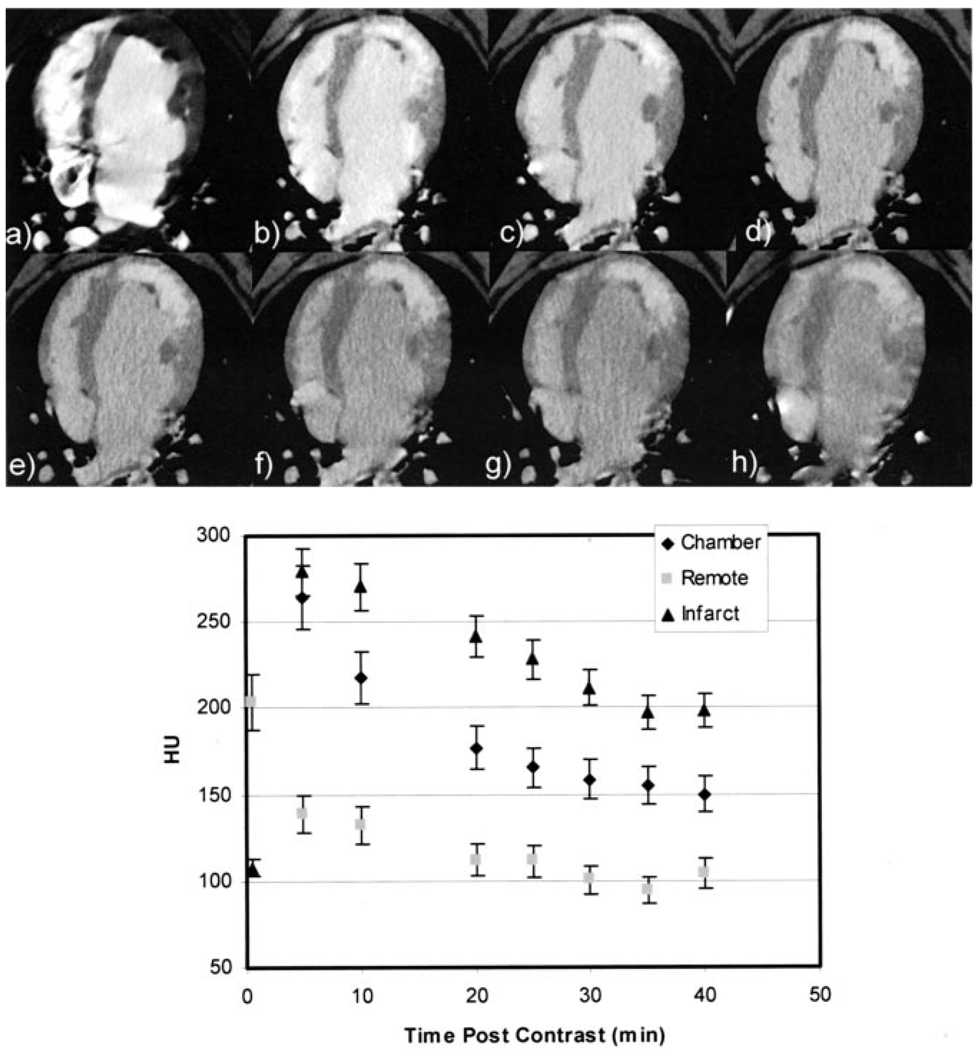
Figure 4.
a–h, Axial temporal image series demonstrating postreperfusion contrast agent kinetics after 150-mL injection of contrast. The first image (a) represents the first-pass image during contrast agent injection. Note that the signal density of the infarct in the first pass is substantially lower than that of the remote myocardium and indicates a subendocardial microvascular obstruction. Five minutes after injection (b), the signal density of the damaged myocardial region is significantly greater than that of the remote myocardium and washes out over time. The plot in (i) represents quantitative contrast kinetics for the LV chamber, remote myocardium, and infarct after contrast injection. As can be appreciated from (b), the infarct becomes well delineated and reaches peak enhancement at 5 minutes after injection and then washes out in proportion to the chamber (blood pool) and remote myocardial signal.

