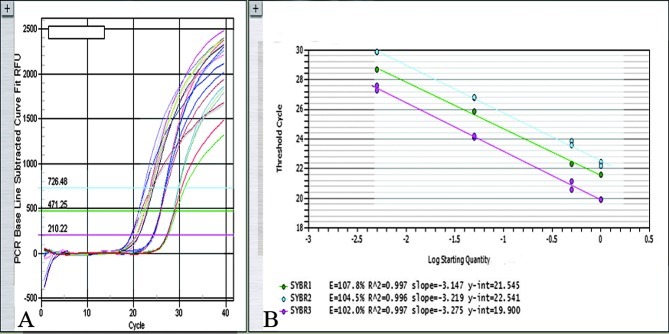
Figure 1.
Taq Man GAPDH, MET and SOX2 standard curves obtained by real-time PCR applied on DNA from FFPE tissue. (A) Amplification plots for four serial dilutions of a normal DNA sample. DNA dilution increases from left to right from 0, 1:2, 1:20 to 1:200 per triplicate. (B) Standard curves plotting the log dilution (x) against the threshold cycle numbers (Ct). The magenta line represents the standard curve obtained for GAPDH, green line for MET and sky-blue line for SOX2. Regression parameters of the standard curves are displayed: E, efficiency of amplification; R^2, coefficient of correlation; y-int, intercept.

