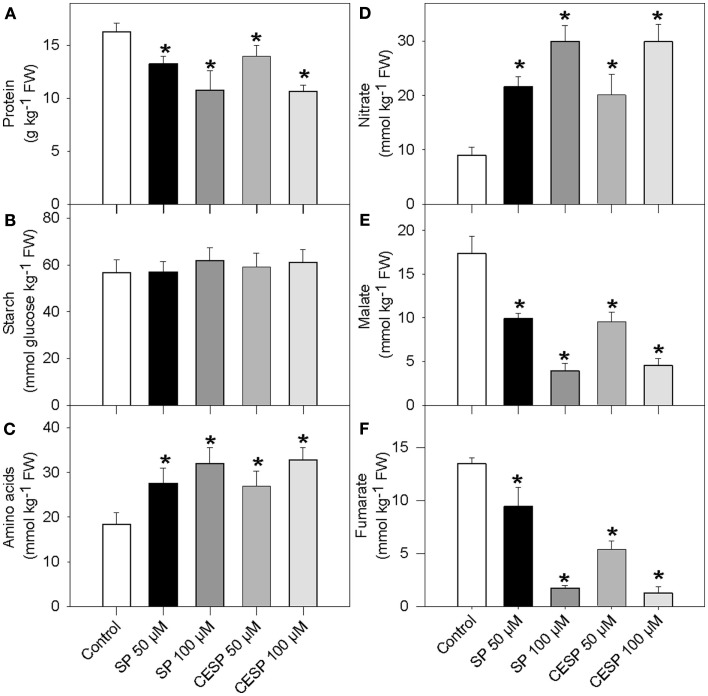
Figure 2.
Effects of the inhibition of the 2-oxoglutarate dehydrogenase complex activity on metabolite levels. Following 4 h incubation of Arabidopsis leaf disks in exactly similar light growth conditions in the absence (white bars) or presence of 50 μM SP (dark bars), 100 μM SP (dark gray bars), 50 μM CESP (gray bars), or 100 μM CESP (light gray bars) levels of protein (A), starch (B), total amino acids (C), nitrate (D), malate (E), and fumarate (F) were measured. Values are means ± SE of six independent samplings. Asterisk indicates values that were determined by the Student’s t-test to be significantly different (P < 0.05) from the control treatment. FW, fresh weight.

