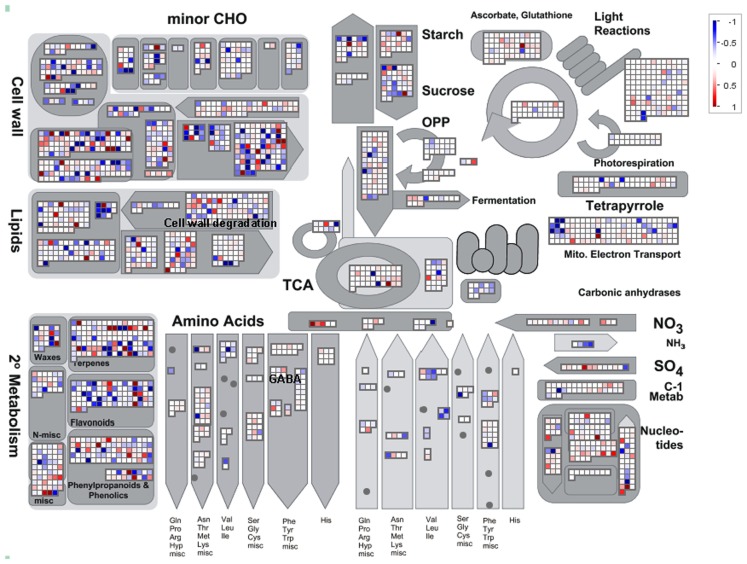
Figure 5.
Overview of the MapMan visualization of differences in transcript levels between control samples and SP-treated samples. Genes associated with metabolic pathways were analyzed by the MapMan software (http://mapman.gabipd.org/web/guest/mapman). Blue and red represent a decrease and an increase of expression, respectively, in the SP-treated samples with respect to the control samples. The color scale used is reproduced in the Figure. Fully expanded leaves of 4-week-old plants were harvested at the middle of the light period, washed three times with 10 mM MES-KOH (pH 6.5), and then incubated in presence or absence of 100 μM of SP during 4 h in 10 mM MES-KOH buffer (pH 6.5) containing 2.0 mM glucose.

