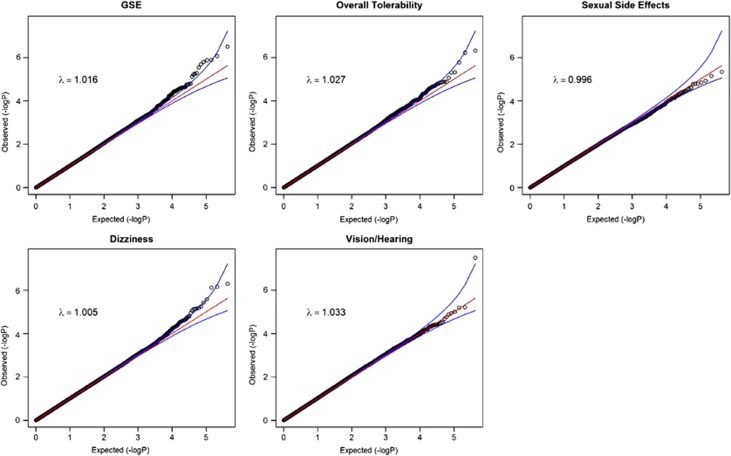
Figure 1.
Quantile–quantile (Q–Q) plots for genome-wide association studies (GWAS) results of five citalopram-induced side effect measures. Points represent −log10(P-values) for each single-nucleotide polymorphism (SNP)–side effect outcome association test. Red lines represent the expected P-value distribution under the null hypothesis of no true associations. Blue lines represent 95% confidence intervals for rejecting the null hypothesis at each P-value rank. The genomic inflation parameter (λ) is defined as the ratio of the median observed P-value to the expected median under the null distribution, thus quantifying systematic test statistic inflation.

