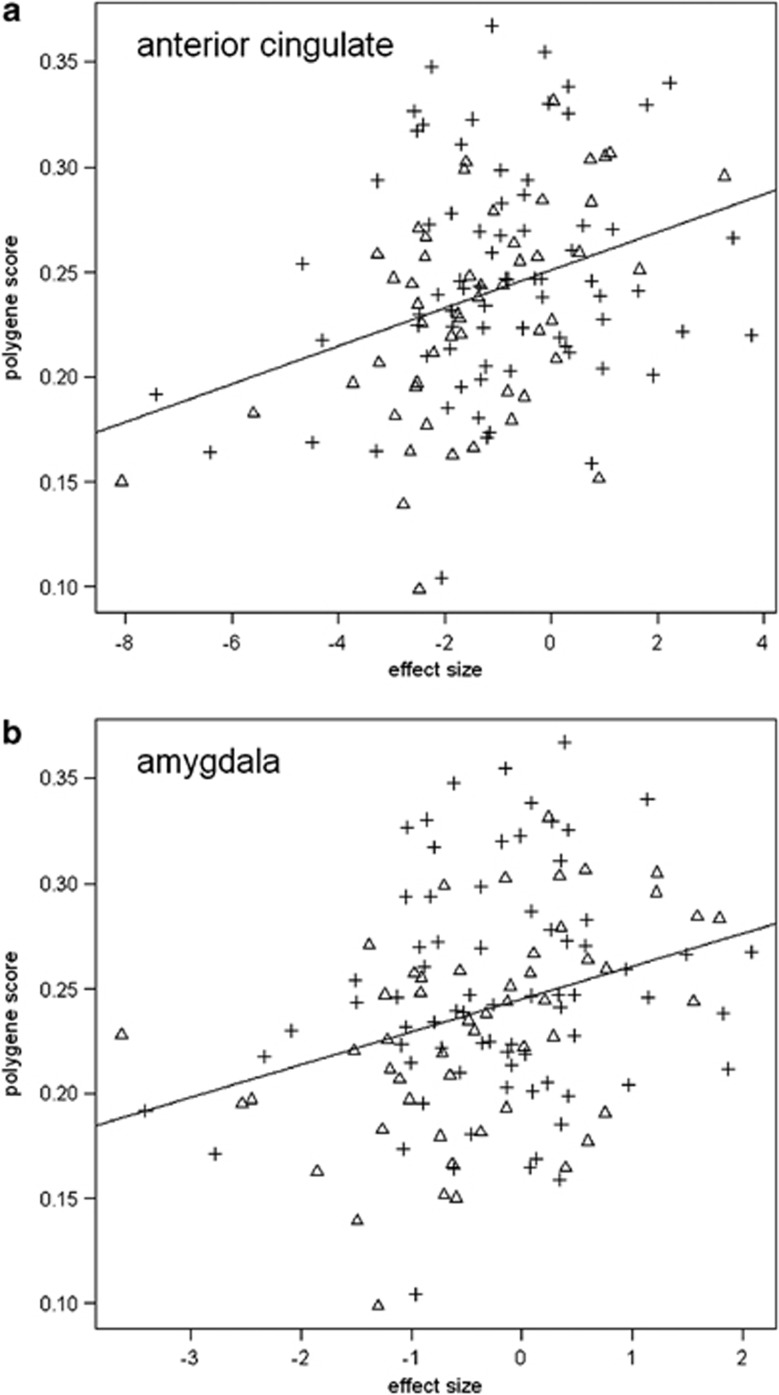
Figure 2.
Scatter graphs of associations between the polygene score and activation in significant clusters. Depicts graphs of extracted data for clusters of significant association in (a) anterior cingulate and (b) amygdala. Triangles represent control subjects, cross hairs represent bipolar high-risk individuals. There were no significant groups × polygene score interaction effects. Overall Pearson's r-values were r=0.32 for the sgACC and r=0.30 for amygdala. For the groups separately, controls r=0.50, r=0.45, and for bipolar high-risk r=0.20, r=0.18 for the sgACC and amygdala, respectively.

