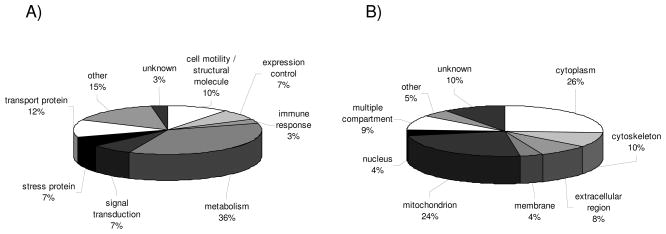
Figure 1.
Classification of unique proteins identified by classical proteomics. The pie charts display the classification of differentially expressed proteins identified by classical proteomics of 21 RCC lesions and corresponding normal kidney epithelium according to (A) functional protein classes and (B) cellular compartments. Each segment in the pie charts represents either a functional gene family (A) or a cellular compartment (B) as indicated by the respective labels. In addition, the relative distribution is indicated as % of the total target number analyzed. Functional protein classes and distribution into cellular compartments < 5% were combined and categorized as “other”.

