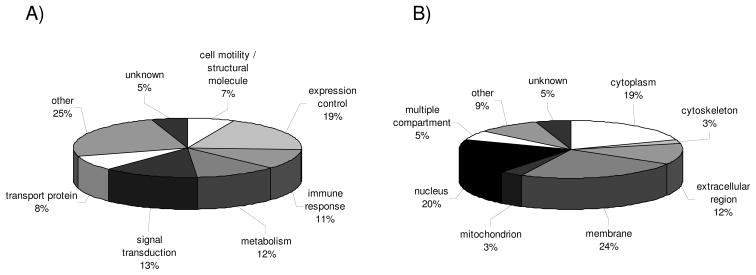
Figure 3.
Classification of differentially expressed genes identified by transcriptome analyses. The pie charts display the data sets obtained by transcriptomics of 13 RCC lesions of the clear cell type, 1 chromophobic and 2 chromophilic RCC lesion along with corresponding normal kidney epithelium and 1 leiomyosarcoma according to their function (A) and cellular localization (B). The layout is in analogy to Fig. 1.

