Figure 1.

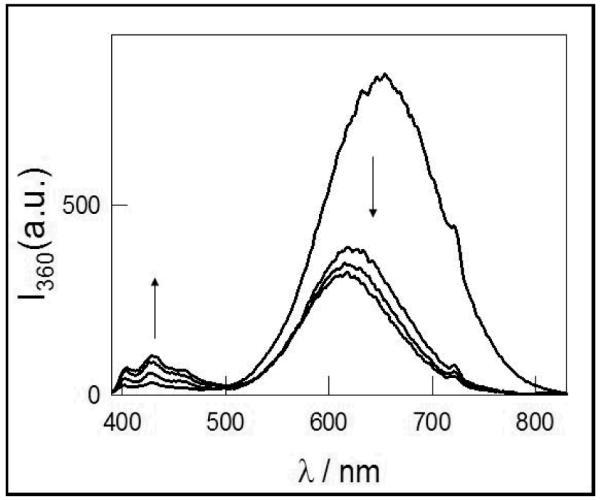
Time evolution of the emission spectra obtained at 360 nm excitation, of as obtained Si-NPs in toluene suspension. The arrows indicate the direction of the increasing and decreasing emission after 2, 5, 16 and 25 days.

Time evolution of the emission spectra obtained at 360 nm excitation, of as obtained Si-NPs in toluene suspension. The arrows indicate the direction of the increasing and decreasing emission after 2, 5, 16 and 25 days.