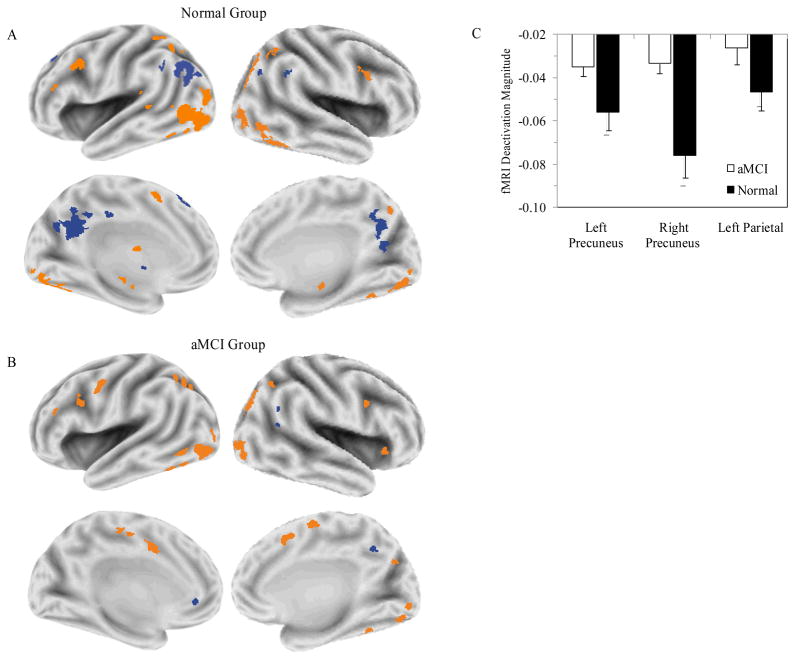
Figure 1.
Task deactivation maps. Voxel-wise maps are presented for the normal group (A) and aMCI group (B). Task deactivations are presented in blue. Task activations associated with the lexical decision task are presented in orange. (C) The magnitudes of deactivation (percentage signal change baseline < lexical decision task) are presented for each group in the left precuneus, right precuneus and left lateral parietal cortex.

