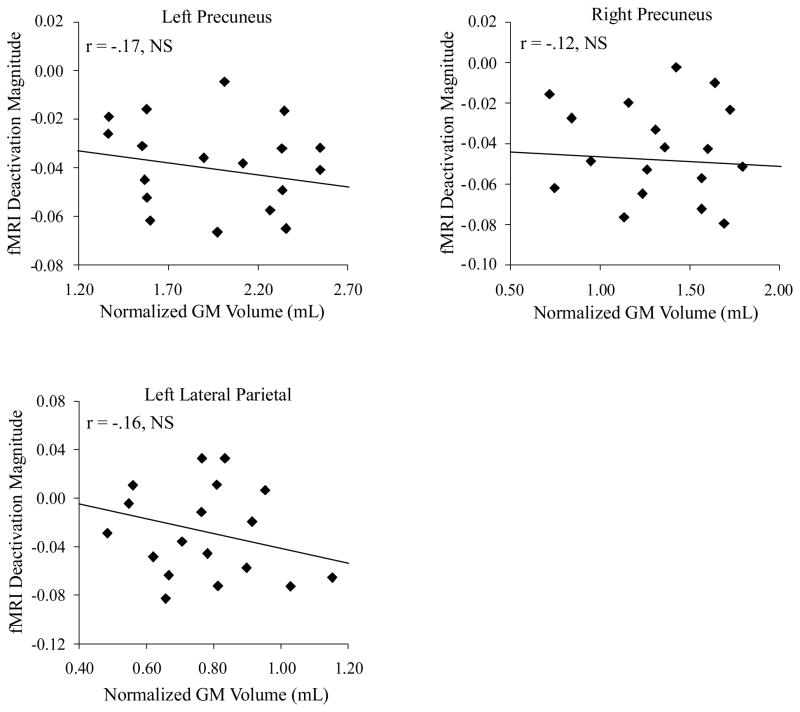
Figure 4.
The relationship between task deactivation and atrophy in parietal regions in aMCI. Regression plots display fMRI deactivation magnitude (percentage signal change fixation < lexical decision task) against normalized GM volume in three regions. Each diamond represents one of the 18 MCI participants. Note the lack of significant relationships between task deactivation and atrophy across parietal DMN regions.

