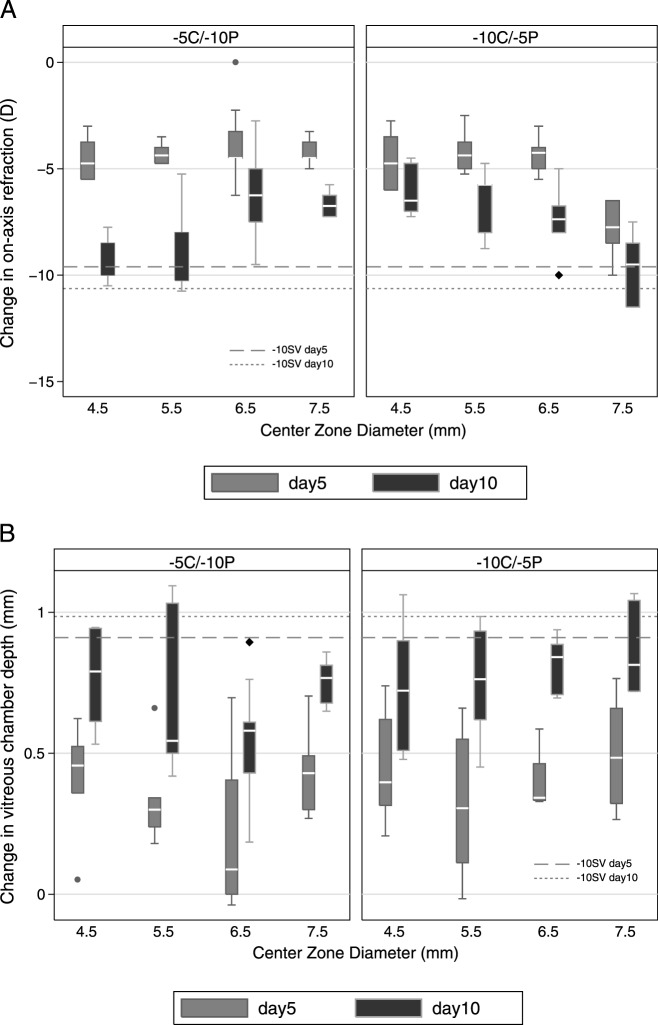
Figure 2. .
Box plots of changes from baseline in central spherical refractive error (top panel), and corresponding changes of vitreous chamber depth (bottom panel) over the treatment period for (A) the −5C/−10P lens type, (B) −10C/−5P lens type, with varying CZD (on X-axis) ranged from 4.5–7.5 mm. Dashed reference lines: mean changes induced by −10 SV lens. Whisker length: the shorter of 1.5 times the interquartile range and the distance to the extreme.

