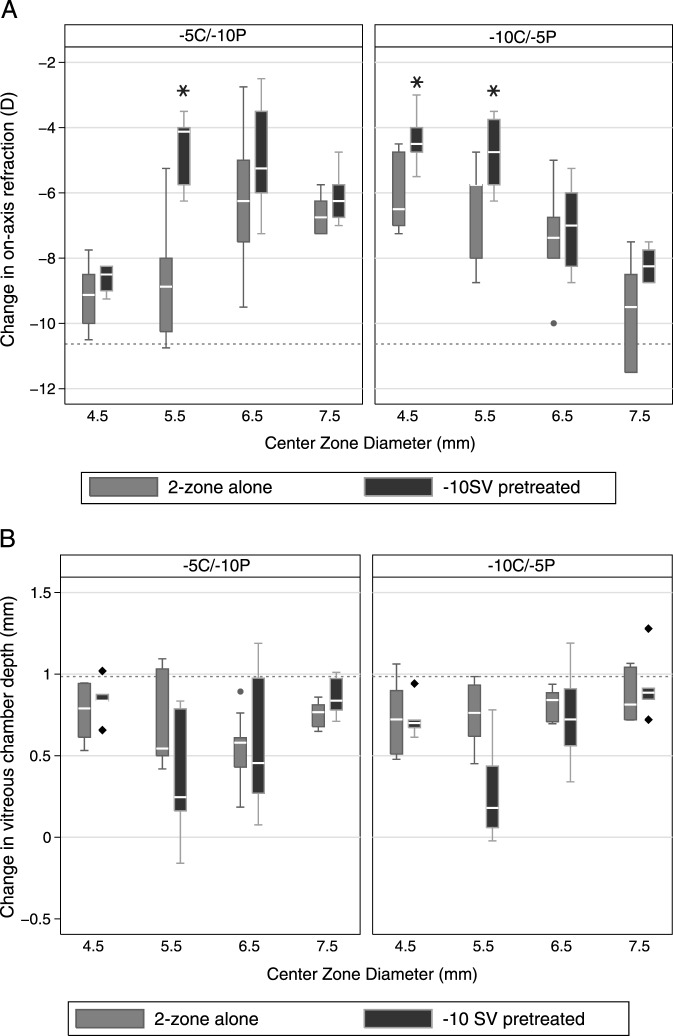
Figure 4. .
Box plots of changes from baseline in central refractive errors (top panel), and corresponding changes in vitreous chamber depth (bottom panel) after (A) 2-zone lens treatment for 10 days, and (B) −10 SV lens pretreatment for 5 days followed by 2-zone lens treatment for 5 days. Dashed reference lines: mean changes induced by −10 SV lens before replacement with a 2-zone lens. Whisker length: the shorter of 1.5 times the interquartile range and the distance to the extreme.

