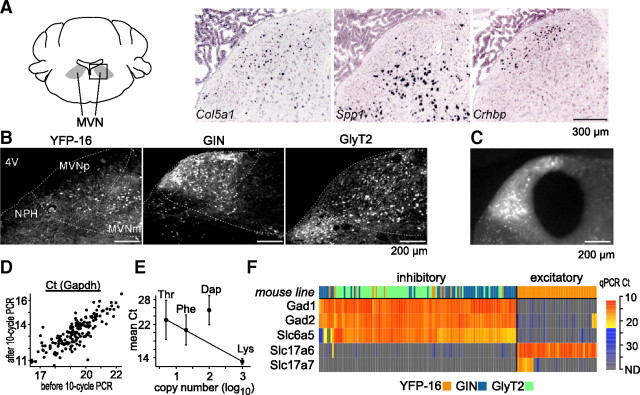
Figure 1.
Molecular anatomy of the MVN. A, Examples of marker gene candidates. Using the Allen Mouse Brain Atlas (Lein et al., 2007), genes expressed in subpopulations of MVN neurons were identified as marker candidates. In situ hybridization images of exemplar marker gene candidates Col5a1, Spp1, and Crhbp are shown. The images were taken from the boxed region in the schematic drawing of the mouse coronal brainstem section (left,∼−5.9 mm from bregma). The distinct distribution of hybridization signal across the three genes imply their potential use as marker genes. Scale bar, 300 μm. B, Representative MVN fluorescent images of YFP-16, GIN, and GlyT2 mouse lines. The single-cell cDNAs were prepared from fluorescent protein-expressing MVN neurons in the three lines. MVNp, parvocellular MVN; MVNm, magnocellular MVN; NPH, nucleus prepositus hypoglossi; 4V, fourth ventricle (darkened for contrast). Scale bar, 200 μm. C, A representative image of MVN after punching out its central portion for single-cell cDNA amplification. Scale bar, 200 μm. D, qPCR results for Gapdh before and after the 10 cycle amplification. Data from all of the single-cell cDNAs (n = 167) are plotted. The linear relationship indicates no systematic distortion in abundance representation of transcripts by the 10 cycle amplification. E, The abundance representation of the spike-in RNAs in the single-cell cDNAs (the 10 cycle PCR product). The mean Ct values in qPCR are plotted against the original copy number of the spike-in RNAs (log-scaled). The cases where Ct value was not determined (no transcript was detected) are excluded from averaging. Lys, Phe, and Thr were on a regression line in the order of copy number, indicating that abundance representation of the three spike-in RNAs was preserved. Dap is not on the same regression line, which is at least partly due to the lower amplification rate of Dap in qPCR (1.79) than the other three (Lys, 2.01; Phe, 1.97; Thr, 2.00). Y-intercept of the regression line is 26.2. Error bar indicates SD. F, The heat map of the single-cell cDNAs (columns) based on the transcript profiles of the transmitter-related genes (rows). Color in the first row indicates the mouse lines from which the single-cell cDNAs were prepared (YFP-16: n = 61, orange; GIN: n = 52, blue; GlyT2: n = 54, green). In the heat map showing qPCR results, Ct values lesser and greater than the mean Ct of spike-in RNA Thr (five copies per sample) are coded in red-yellow and blue-gray gradation, respectively. Excitatory (Slc17a6-positive) and inhibitory (Gad1-positive) cell groups are defined clearly by the transcript profiles. As expected, YFP-16 neurons are both excitatory and inhibitory, while GIN and GlyT2 cells are only inhibitory. Note the coexpression of Gad1, Gad2, and Slc6a5 in the inhibitory cell group.

