
Figure 4.
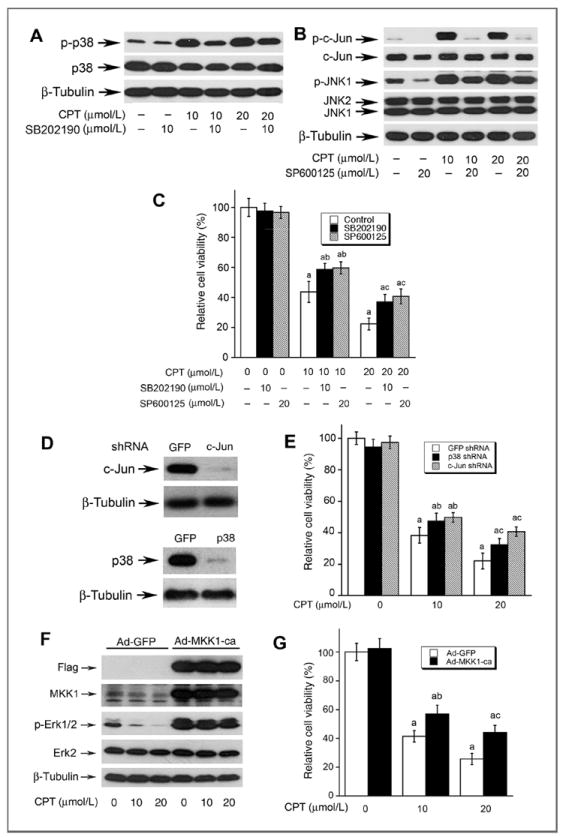
CPT-induced cell death is in part by activation of p38/JNK and inhibition Erk1/2. A–C, DU145 cells, grown in 6-well plates (A and B) or 96-well plates (C), were pretreated with or without SB202190 (10 μmol/L) or SP600125 (20 μmol/L) for 30 minutes, and then exposed to CPT (0, 10, 20 μmol/L) for 8 hours (for Western blotting), or for 48 hours (for cell viability), followed by Western blot analysis using indicated antibodies (A and B), or cell viability assay using one solution reagent (C). D, Rh30 cells grown in 6-well plates were infected with lentiviral shRNAs to p38, c-Jun, and GFP, respectively. In 5 days, whole-cell lysates were subjected to Western blotting using indicated antibodies. Note: Lentiviral shRNA to p38 or c-Jun, but GFP, downregulated cellular protein expression of p38 or c-Jun by approximately 90%. E, Rh30 cells grown 96-well plates, infected with lentiviral shRNA to p38, c-Jun, and GFP, respectively, were exposed to CPT at indicated concentrations for 48 hours, followed by cell viability assay using one solution reagent. Results are presented as mean ± SE (n = 3). a, P < 0.05, difference versus GFP shRNA group; b, P < 0.05, difference versus 10 μmol/L SB202190 group; c, P < 0.05, difference versus 20 μmol/L SP600125 group. F, Rh30 cells grown in 6-well plates were infected with recombinant adenoviruses expressing Flag-tagged constitutively active MKK1 (Ad-MMK1-ca) and GFP (Ad-GFP, control), respectively. In 24 hours, whole-cell lysates were subjected to Western blotting using indicated antibodies. Note: Ad-MKK1-ca, but Ad-GFP, increased expression of MKK1 by 5-fold in Rh30 cells. G, Rh30 cells grown in 96-well plates, infected with Ad-MKK1 and Ad-GFP respectively, were exposed to CPT at indicated concentrations for 48 hours, followed by cell viability assay using one solution reagent. Results are presented as mean ± SE (n = 3). a, P < 0.05, difference versus 0 μmol/L CPT group; b, P < 0.05, difference versus 10 μmol/L CPT group; c, P < 0.05, difference versus 20 μmol/L CPT group.