
Figure 6.
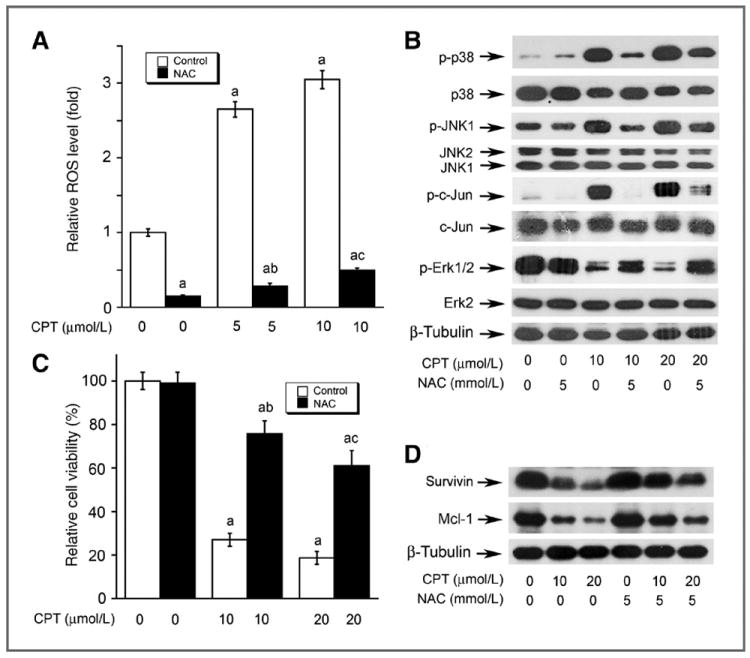
The effects of CPT on MAPKs are attributed to induction of ROS. DU145 cells, grown in 96-well plates (A and C) or 6-well plates (B and D), were pretreated with or without 5 mmol/L NAC for 30 minutes and then exposed to CPT at indicated concentrations for 24 (for ROS detection and Western blotting) or 48 hours (for cell viability assay), followed by ROS detection using CM-H2DCFDA (A), Western blot analysis (B and D) using indicated antibodies, or cell viability assay using one solution reagent (C). Results are presented in (A) and (C) as mean ± SE (n = 6). a, P < 0.05, difference versus 0 μmol/L CPT group; b, P < 0.05, difference versus 5 μmol/L (A) or 10 μmol/L (C) CPT group; c, P < 0.05, difference versus 10 μmol/L (A) or 20 μmol/L (C) CPT group.