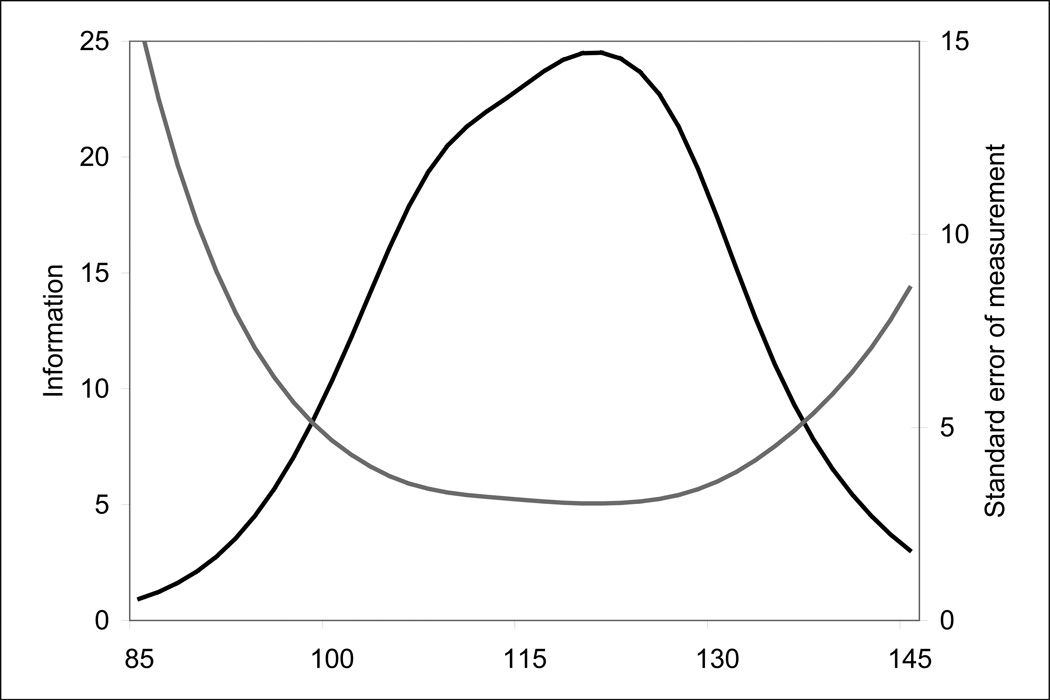
Figure 2.
Test information curve and standard error of measurement for the PHQ-9*.
* The black curve shows the amount of measurement precision (“information”) at each depression level. The gray curve shows the standard error of measurement associated with each depression level. The PHQ-9 is characterized by fairly good reliability for individuals with depression levels from 100–130, while below 100 the reliability of the instrument is quite limited, and above 130 or so the reliability again begins to diminish. The clinical implication of this finding is that PHQ-9 scores between 100 and 135 or so are characterized by a standard error of 5 points or fewer, while scores below 100 and above 135 are characterized by larger standard errors. This means those with low levels of depression (<100 points) and high levels of depression (>135 points) are measured less accurately than those with moderate levels of depression. These results are to be contrasted with Crohnbach’s alpha, which would provide a single omnibus statistic summarizing reliability as if it were a constant across the range of depression measured by the test. Item response theory (IRT) output provides both the point estimate of the individual’s score along with the standard error associated with that score. Clinicians should become used to seeing both of these results reported.

