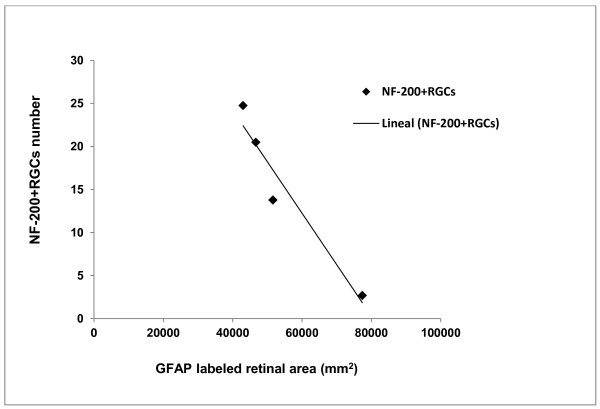
Figure 6.
Correlation of GFAP-labeled retinal area (GFAP-RA) versus NF-200+RGC number in OHT-eyes after 15 days of laser-induced OHT. There was a trend for the GFAP-RA to decrease and for the NF-200+RGC number to increase from the disc to the periphery in OHT-eyes. Data regarding GFAP-RA are the same as in Figure 3. OHT, ocular hypertension; RGCs, retinal ganglion cells.

