
Figure 3. Faces are similar yet different.
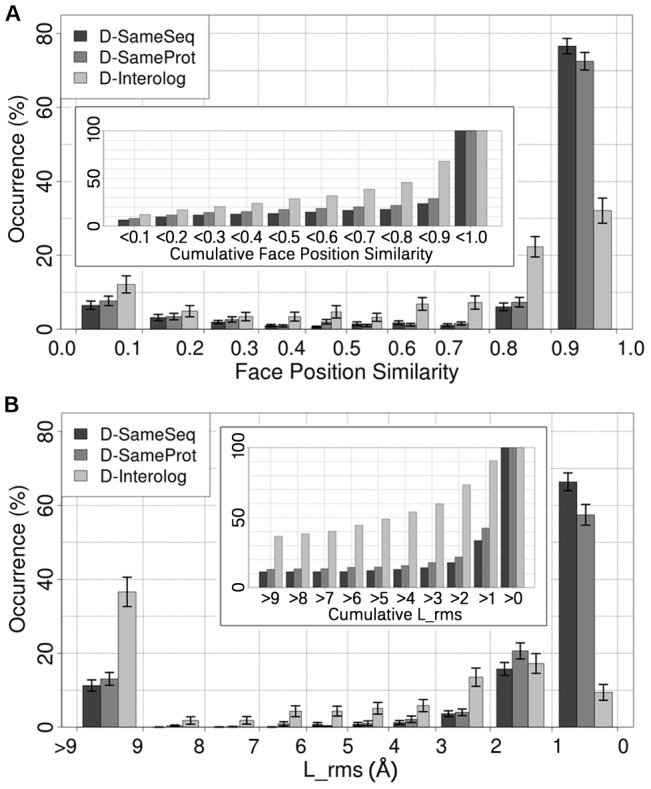
For two different ways to measure interface similarity - Face Position Similarity [A] and L_rms [B] - we present the similarity distribution for all interfaces. The rightmost interval shows largely identical faces, the leftmost completely different faces. For each similarity range and measure, there are three bars: one for each type of sequence divergence (D-SameSeq to D-Interolog). For example, Face Position Similarity finds about 7% of all the interface similarities at D-SameProt to fall in the range 0.0–0.1, i.e. suggests in 7% of the cases completely different outcomes when experimentally measuring the same interaction again. The error bars show standard errors and are explained in Section S1.3 in Text S1. The inlet displays the cumulative distribution giving the fraction of all similarities that differ by a certain value. For instance, 21% of all interface comparisons result in a value above 2 Å according to the L_rms in D-SameProt. In these cases, the two smaller proteins are clearly not in the same position after superimposing the two larger proteins.