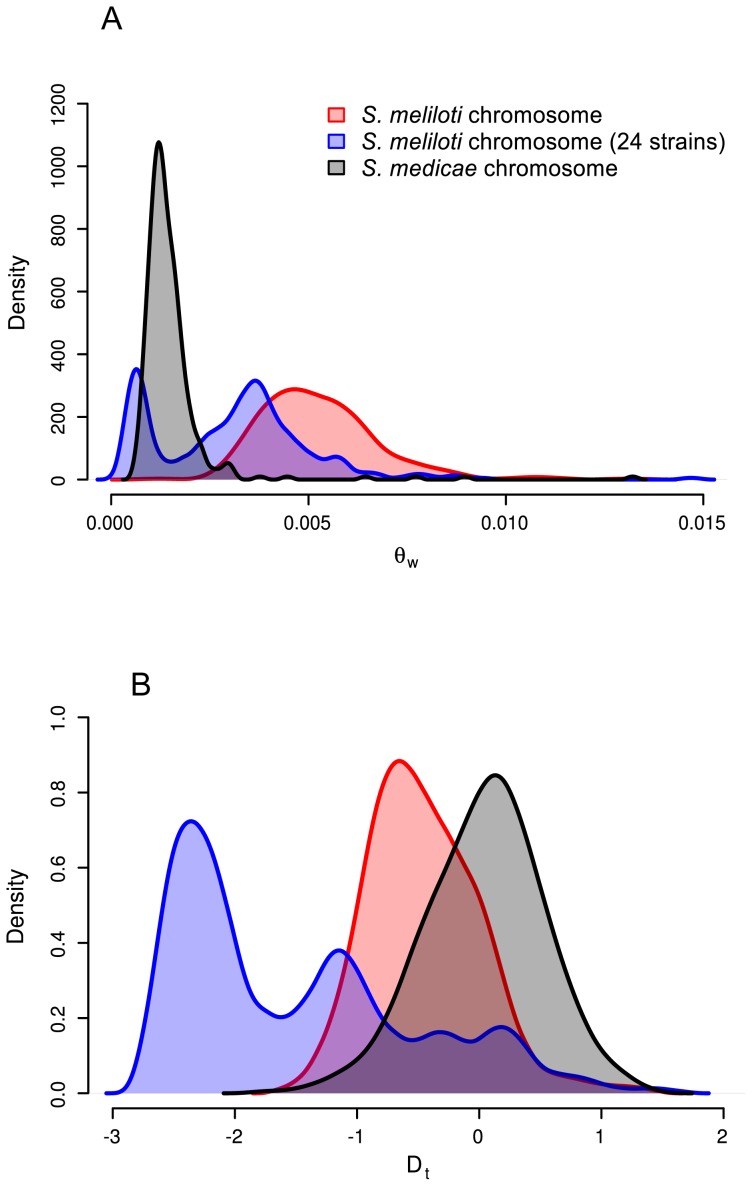
Figure 3. Distributions of chromosomal nucleotide diversity statistics.
A) θW and B) DT calculated on non-overlapping 10,000 base pair sliding windows. Only windows for which >8,000 bp were covered in >80% of strains are included. Plots were drawn using the R density function with the cosine smoothing kernel [60].

