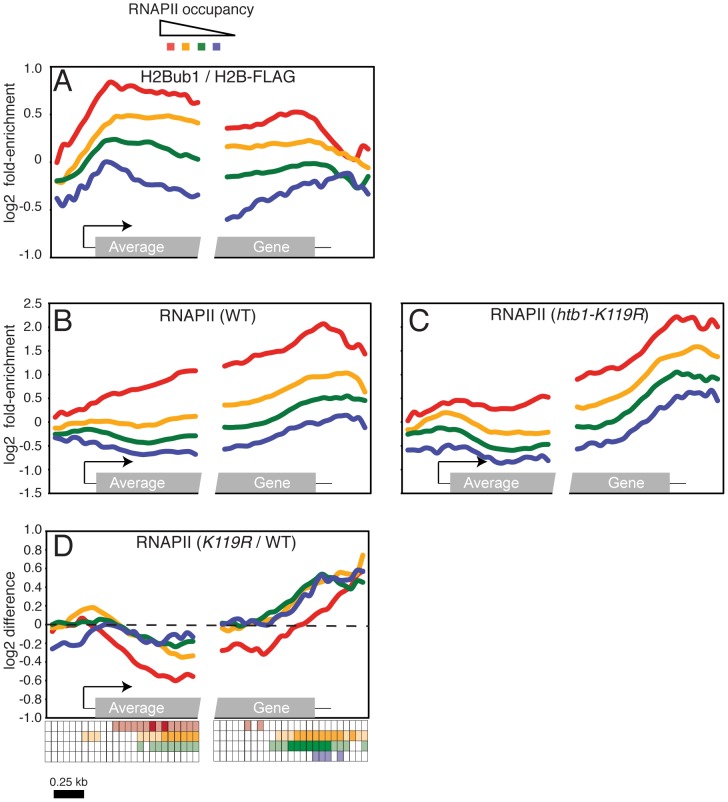
Figure 1. Loss of H2Bub1 globally alters distribution of RNAPII in gene coding regions.
(A) Average distribution of H2Bub1 at 540 S. pombe genes, as determined by ChIP-chip. Genes were grouped according to total levels of RNAPII enrichment (see key at top). The grey box in the “average gene” representation at bottom denotes the gene coding region; 5′ and 3′ untranslated regions are denoted by thin black lines. The arrow denotes the transcription start site. (B) Average distribution of RNAPII at 540 S. pombe genes, as determined by ChIP-chip in a wild-type strain (JTB62-1). Genes were grouped according to total levels of RNAPII enrichment. (C) As in (B), determined in an htb1-K119R mutant strain (JTB67-1). Gene groupings were created using wild-type RNAPII enrichment values. (D) Average distributions of differences between mutant and wild-type RNAPII enrichment grouped according to RNAPII enrichment in wild-type cells. The key below the graph illustrates the statistical significance of the differences for each group at 50 positions along the average gene. The rows of the key are color-coded according to the graph. Open squares denote p>0.01; light shading denotes 0.01>p>10exp-5; dark shading denotes p<10exp-5 (one-sample t-tests; μ0 = 0). Note that there is only light shading for the last row (corresponding to the blue curve).

