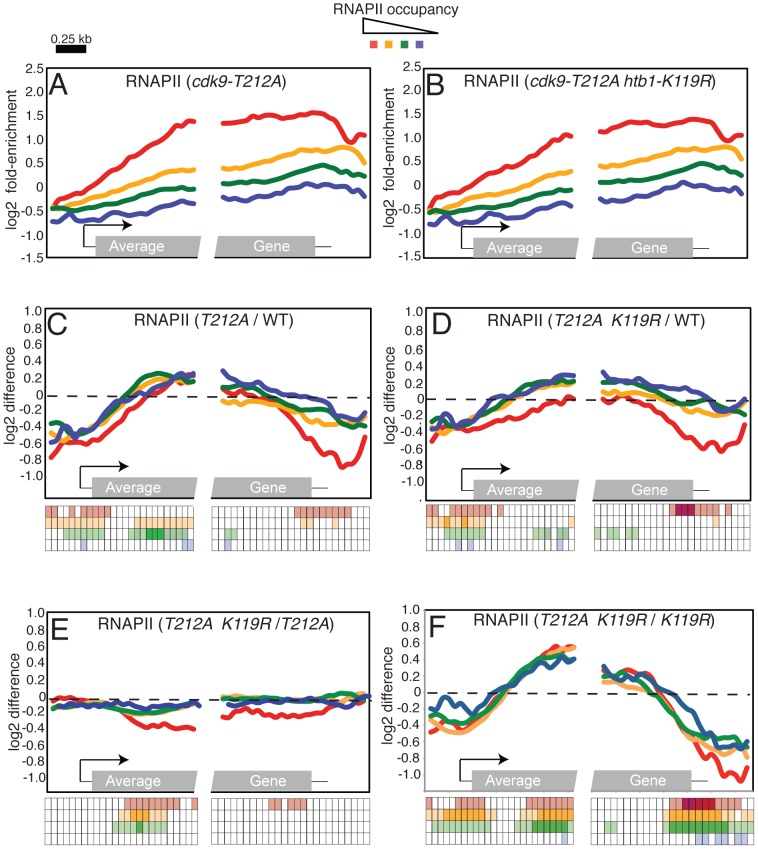
Figure 7. Opposing effects of H2Bub1 and Cdk9 activity on RNAPII distribution revealed by ChIP–chip.
(A) Average distribution of RNAPII at 540 S. pombe genes, as determined by ChIP-chip in a cdk9-T212A strain (JTB325). Genes were grouped according to total levels of RNAPII enrichment. (B) As in (A) for cdk9-T212A htb1-K119R (JTB326). (C) Average distributions of differences between cdk9-T212A (JTB325) and wild-type (JTB62-1) RNAPII enrichment grouped according to RNAPII enrichment in wild-type cells. (D) As in (C) for differences between cdk9-T212A htb1-K119R and wild-type RNAPII enrichment. (E) As in (C) for differences between cdk9-T212A htb1-K119R and cdk9-T212A RNAPII enrichment. (F) As in (C) for differences between cdk9-T212A htb1-K119R and htb1-K119R RNAPII enrichment. The keys below C-F illustrate the statistical significance of the differences for each group at 50 positions along the average gene. The rows of the key are color-coded according to the graph. Open squares denote p>0.01; light shading denotes 0.01>p>10exp-5; dark shading denotes p<10exp-5 (one-sample t-tests; μ0 = 0). Note that there is only light shading for the last row (corresponding to the blue curve).

