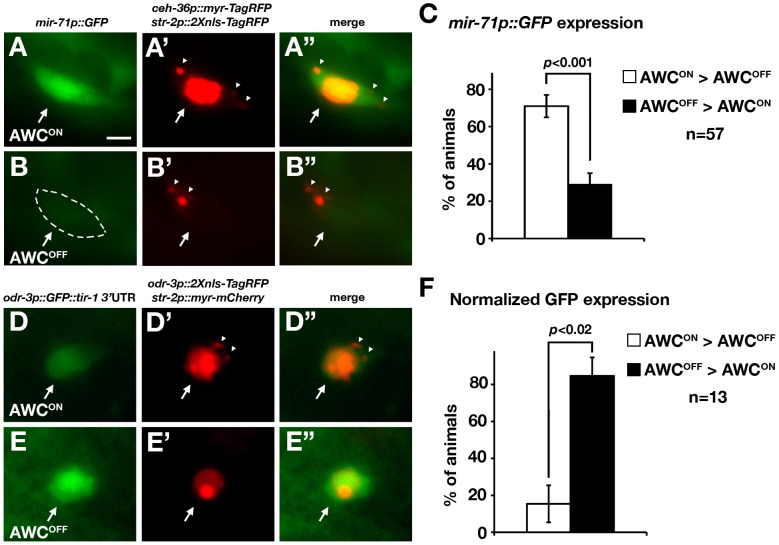
Figure 4. mir-71 expression and the tir-1 3′ UTR are differentially regulated in AWCON and AWCOFF neurons.
(A, B) Images of mir-71p::GFP. The AWCOFF cell body is outlined by dashed lines, which was done when the GFP intensity was temporarily enhanced with the Photoshop levels tool. (A′, B′) Images of ceh-36p::myr-TagRFP and str-2p::2Xnls-TagRFP. AWCON was identified as str-2p::2Xnls-TagRFP positive and ceh-36p::myr-TagRFP positive (A′). AWCOFF was identified as str-2p::2Xnls-TagRFP negative and ceh-36p::myr-TagRFP positive (B′). (A″) Merge of A and A′ images from the same cell. (B″) Merge of B and B′ images from the same cell. (C) Quantification of mir-71p::GFP expression in AWCON and AWCOFF cells. (D, E) Images of odr-3p::GFP::tir-1 3′ UTR. (D′, E′) Images of odr-3p::2Xnls-TagRFP::unc-54 3′ UTR and str-2p::myr-mCherry. The AWCON cell was identified as str-2p::myr-mCherry positive and odr-3p::2XTagRFP positive (D′). The AWCOFF cell was defined as str-2p::myr-mCherry negative and odr-3p::2Xnls-TagRFP positive (E′). (D″) Merge of D and D′ images from the same cell. (E″) Merge of E and E′ images from the same cell. (F) Quantification of normalized GFP expression in AWCON and AWCOFF cells. Normalized GFP expression was determined by calibrating GFP intensity with 2Xnls-TagRFP intensity of the same cell. All constructs, except for odr-3p::GFP::tir-1 3′ UTR, contain the unc-54 3′ UTR. All images were taken from first stage larvae. The single focal plane with the brightest fluorescence in each AWC was selected from the acquired image stack and measured for fluorescence intensity. Each animal was categorized into one of three categories: AWCON = AWCOFF, AWCON>AWCOFF, and AWCOFF>AWCON based on the comparison of GFP intensities between AWCON and AWCOFF cells of the same animal. We did not observe any animals that fell into the “AWCON = AWCOFF” category from our GFP intensity analysis. Total number of animals for each category was tabulated and analyzed as described [86]. p-values were calculated using X 2 test. Error bars represent standard error of proportion. Arrows indicate the AWC cell bodies. Arrowheads represent myr-TagRFP or myr-mCherry signal. Scale bar, 2 µm.

