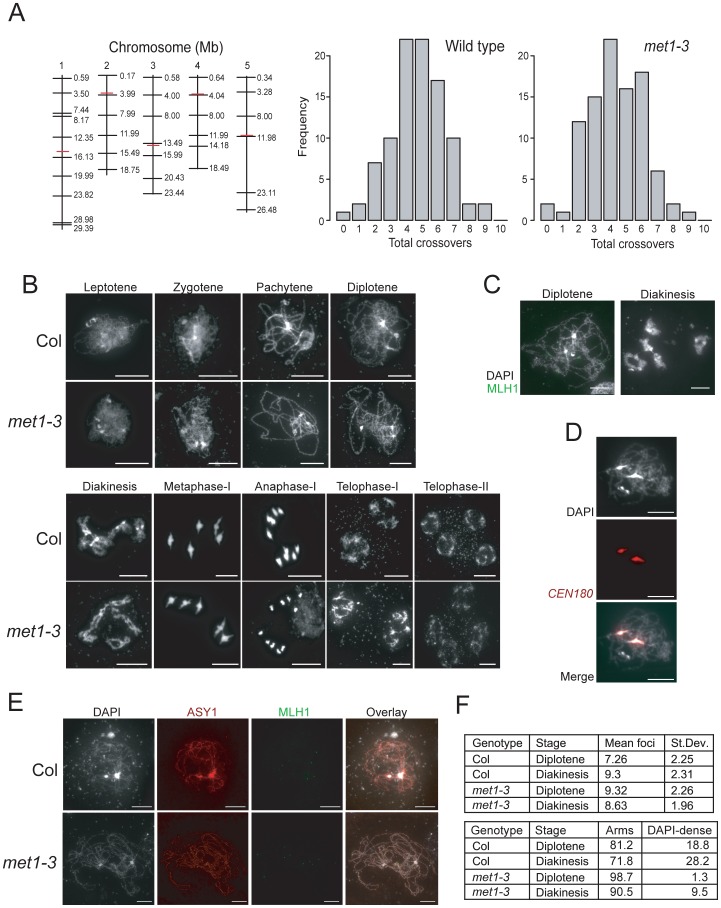
Figure 4. Total crossover numbers are similar between wild type and met1–3.
(A) Physical maps of chromosomes (vertical black lines) with KASPar marker (horizontal black lines) and centromere (horizontal red lines) positions indicated. Histograms showing the frequency of total CO numbers identified in male backcross individuals from either Col/Ler F1 (wild type) or met1–3−/− Col/Ler F1 (met1–3) parents. (B) Micrographs of DAPI-stained anther meiocytes showing the labeled stage of meiosis in Col and met1–3−/−. (C) Micrographs of diplotene and diakineses stage male meiocytes stained with DAPI (white) and immunostained for MLH1 (green). (D) Micrographs showing co-localisation of dense-DAPI staining and in situ hybridization with the CEN180 satellite repeat (red). (E) Micrographs of male meiocytes stained with DAPI (white) and immunostained with MLH1 (green) and the axis component ASY1 (red). (F) The upper table lists mean MLH1 foci numbers in wild type and met1–3−/− at diplotene or diakinesis with standard deviation (+/−). The lower table lists the relative proportions (%) of MLH1 foci localizing to chromosome arm regions (arms) vs densely-DAPI staining regions (DAPI-dense). All scale bars represent 10 µM. See also Table S4 and S5.

