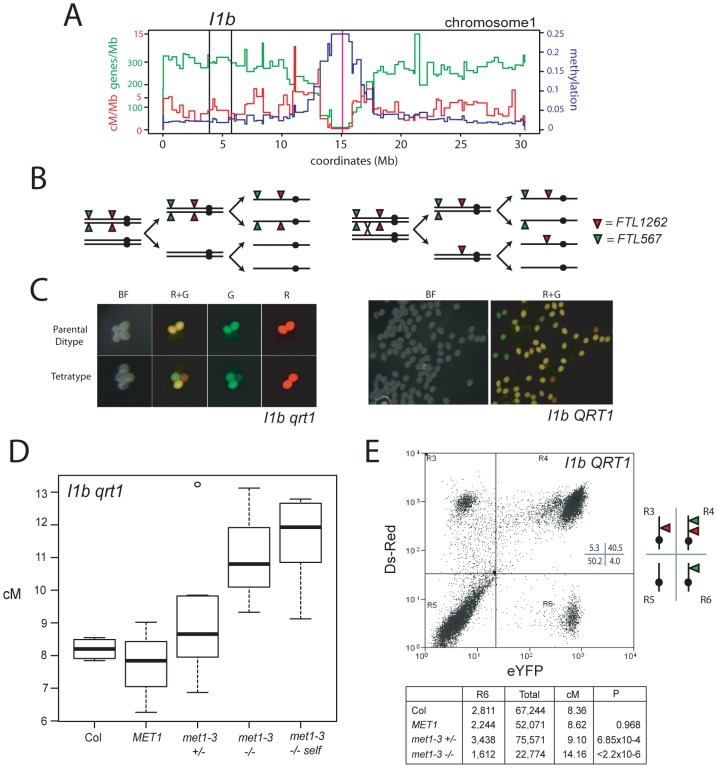
Figure 5. Elevated euchromatic crossovers in met1–3.
(A) Physical map of chromosome 1 with overlaid gene/Mb (green), DNA methylation (blue) and cM/Mb (red) plots. Black vertical lines indicate the I1b transgene insertions and the magenta vertical line indicates the centromere. (B) Schematic diagram showing homologous chromosomes (black lines) heterozygous for cis-linked FTL567 (eYFP) and FTL1262 (RFP) transgenes segregating through meiosis in the absence or presence of a CO. (C) Fluorescence micrographs showing qrt1–2−/− or QRT1 pollen from I1b cis-heterozygotes. (D) I1b genetic map length for naïve wild type (Col), MET1, met1–3+/− and met1–3−/− segregants and self-fertilized met1–3−/− (met1-self) measured by qrt1–2−/− tetrad counting. (E) I1b genetic map length for naïve wild type (Col) and MET1, met1–3+/− and met1–3−/− segregants measured by flow cytometry of individual pollen grains. A representative flow cytometry histogram from an I1b cis-heterozygote together with gate quadrant R6 counts, adjusted total pollen counts and cM. See also Table S6.

