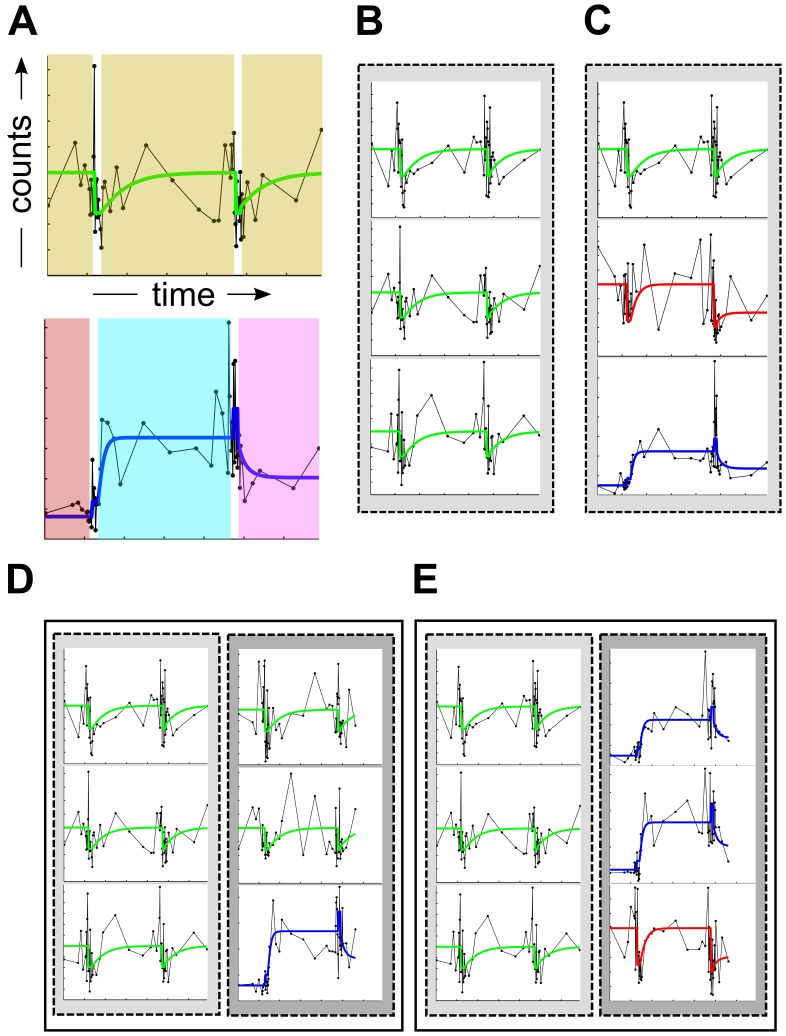
Figure 2. Schematics of microbial ecosystems illustrating Signature Diversity scores at multiple levels of resolution.
The panels depict examples of simplified microbial ecosystems measured over time, to illustrate three levels of Signature Diversity (SD) scores computed by the Microbial Counts Trajectories Infinite Mixture Model Engine (MC-TIMME) framework. (A) Intra-signature diversity (SD1), characterizes the dimensionality of each prototype signature. The top panel depicts a prototype signature with a lower SD1 score than the prototype signature in the bottom panel, which exhibits different equilibrium levels and relaxation time constants on each of the shaded intervals. (B–C) Intra-ecosystem signature diversity (SD2), characterizes the extent of prototype signature sharing among taxa within a host ecosystem. Host ecosystem (B) has a lower SD2 score than (C), because all taxa in (B) share the same prototype signature. (D–E) Inter-ecosystem signature diversity (SD3), characterizes the extent of prototype signatures haring across ecosystems. Each panel depicts two ecosystems. The two ecosystems in (D) have a lower SD3 score than those in (E), because more prototype signatures are shared between the ecosystems in D.

