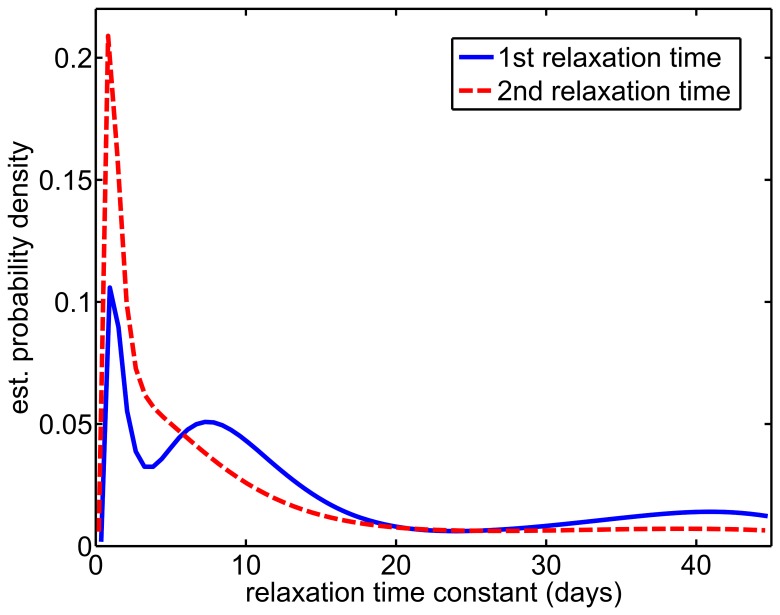
Figure 4. Relaxation Time Distributions for responses of human gut commensals to repeated antibiotic exposures.
Each relaxation time constant characterizes the time for a reference operational taxonomic unit (refOTU) to reach an equilibrium relative abundance level in the ecosystem after an antibiotic pulse. Probability density functions were estimated for either the first post-antibiotic exposure interval (solid blue line, “1st relaxation time”) or the second post-antibiotic exposure interval (dashed red line, “2nd relaxation time”). A smoothing kernel algorithm was used to estimate probability density functions, using relaxation time constants from refOTUs from all subjects (756 time constants for each post-antibiotic exposure interval).

