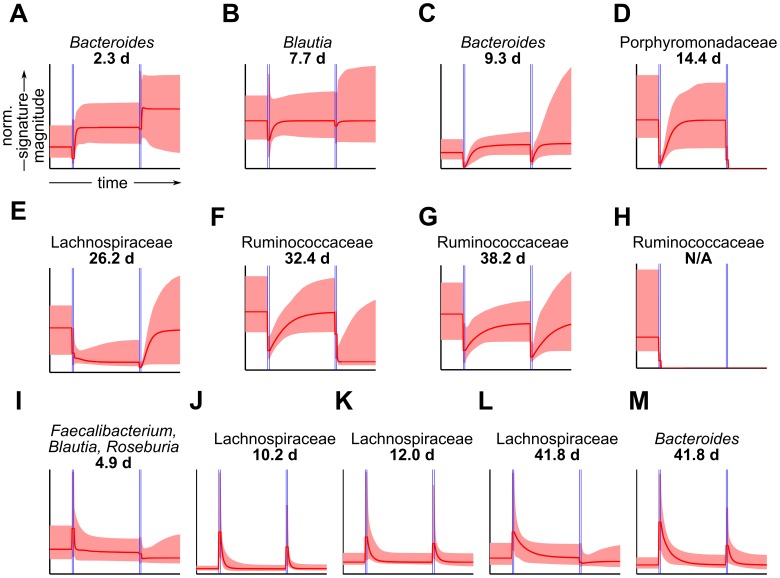
Figure 5. Consensus Signature Groups of human gut commensals ordered by relaxation time after first antibiotic pulse.
Each panel (A–M) depicts a Consensus Signature Group (CSG), with signatures conformed to a common time-scale and amplitude to facilitate comparison across subjects and CSGs. Displayed CSGs are those containing at least one reference operational taxonomic units (refOTUs) shared among all subjects, and significantly enriched for at least one taxonomic label at the family or genus level (false discovery rate <0.05, hypergeometric tests). The horizontal axis indicates time in days and the vertical axis indicates normalized signature amplitude. Red dashed lines depict median inferred signatures, and shaded red areas indicate 95% credible intervals. Horizontal blue lines depict antibiotic exposure windows. Numbers above plots indicate relaxation time constants in units of days.(A–H) are CSGs showing decreases in relative abundance during the first antibiotic pulse, and (I–M) are CSGs showing increases in relative abundance during the first antibiotic pulse.

