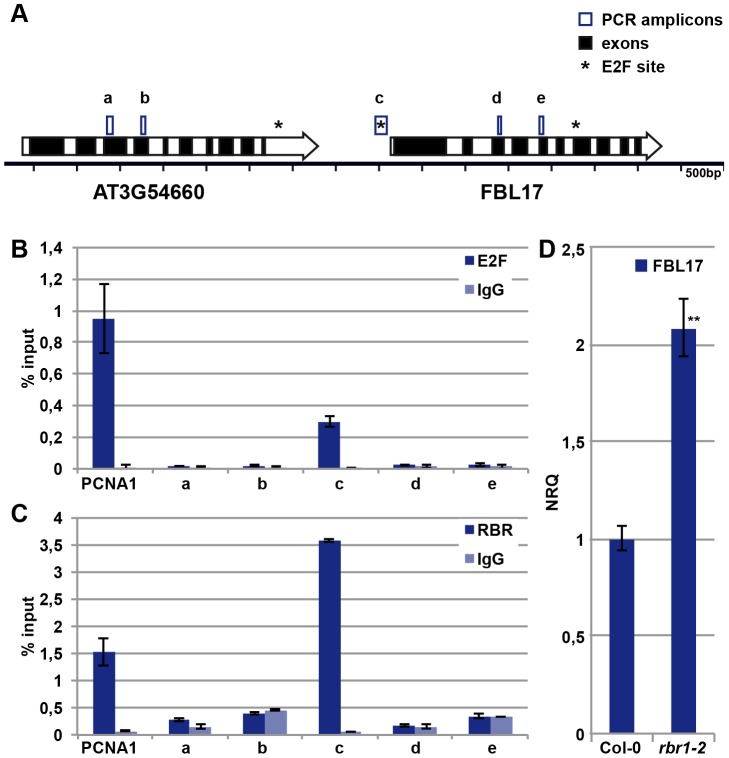
Figure 5. E2FA and RBR control the expression of FBL17.
(A) Sketch of the genomic region of FBL17 in the Arabidopsis genome. Genes are represented by large arrows with exons in black and introns in white, predicted E2F binding sites are marked with an asterisk, and the five PCR amplicons used in ChIP analyses are boxed (a, b, c, d, e). (B) E2FA ChIP. Wild-type plants were used for ChIP experiments with an antibody directed against E2FA. The amplicon ‘c’ in the promoter region of FBL17 showed enrichment for E2FA, whereas the regions ‘a’, ‘b’, ‘d’ and ‘e’ were not specifically amplified. The known E2FA target, PCNA1, was used as positive control. Negative controls were done without antibody (IgG). (C) RBR1 ChIP. Transgenetic plants expressing PRORBR1:RBR1-mRFP were used in ChIP with a DsRed antibody. The amplicon ‘c’ in the promoter region of FBL17 showed enrichment for RBR1-mRFP, in contrast to the regions ‘a’, ‘b’, ‘d’ and ‘e’. The known RBR1 target, PCNA1, was used as positive control. Negative controls were done without antibody (IgG). (D) Quantitative expression analysis of FBL17 by qRT-PCR in the wild type and rbr1–2−/− mutants. The mean plus/minus standard deviation of the normalized relative quantities (NRQ) of three biological replicates are shown. The stars indicate statistically significant differences based on a t-test of log-transformed data with a p<0.01.

