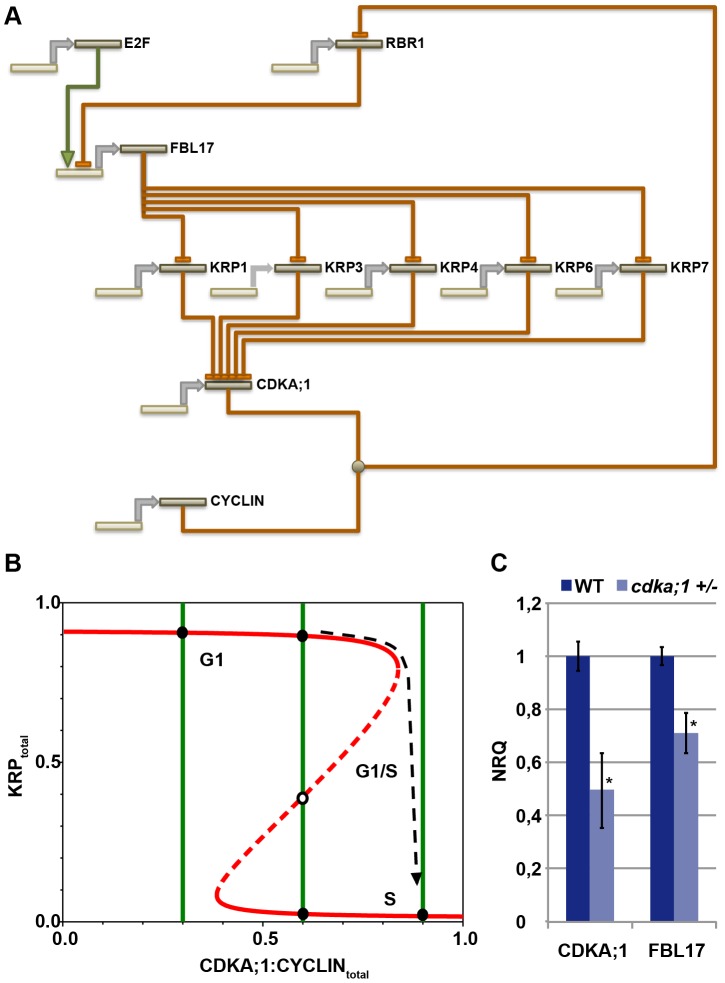
Figure 7. General G1/S phase cell-cycle control module.
(A) The transcription factor E2F activates the expression of FBL17, which is repressed by RBR1. FBL17 targets the CDKA;1 inhibitors KRP1, KRP3, KRP4, KRP6 and KRP7 for proteasome-dependent degradation, enabling the germ cell to progress through S phase. Phosphorylation of RBR by the CDKA;1-cyclin complex will relieve the inhibition of the S-phase genes and allows transcription of the FBL17 gene. Promoters and genes are depicted in light sand color; proteins in dark sand; transcription is indicated by a grey arrow; negative regulation, i.e. at the transcriptional or protein level, is shown by rust-colored lines with a blunt end; positive regulation by a green line with a green arrowhead. Receiving input is placed above and executing output under the respective gene/protein. (B) The model presented in A gives rise to a bistable switch controlling the G1-to-S transition in the plant cell cycle. KRPs inhibit the CDKA;1-cyclin complexes, which in turn downregulate the levels of KRPs by phosphorylating and inhibiting RBR1, thereby activating E2F-dependent FBL17 synthesis leading to the degradation of KRPs. The antagonistic interaction between CDKA;1 and KRP is illustrated by the two curves (red and green for KRP and for CDKA;1, respectively) along which the rates of synthesis and degradation of KRPs and the CDKA;1-cyclin complexes are exactly balanced. The KRP balance curve has an inverse S-shape with high and low levels, depending on the CDKA;1-cyclin values. The dashed branch of the balance curve represents unstable steady states. At low CDKA;1-cyclin levels, only one steady state exists with high KRP levels and low CDKA;1 activity. At intermediate CDKA;1 levels, the system is bistable with three steady states. At high CDKA;1-cyclin values, the steady-state level of KRP is low and the CDKA;1-cyclin complexes are fully active. The transition from high to low KRP values corresponds to the G1-to-S transition. (C) Quantitative expression analyses of CDKA;1 and FBL17 in wild type and heterozygous cdka;1 mutants. The mean plus standard deviation of the normalized relative quantities (NRQ) of three biological replicates are shown. The stars indicate statistically significant differences based on a t-test of log-transformed data with a p<0.05. As expected, the expression of CDKA;1 drops by approximately 50% in the mutant. In addition, FBL17 expression declines, consistent with a prediction of the model presented in A and B.

