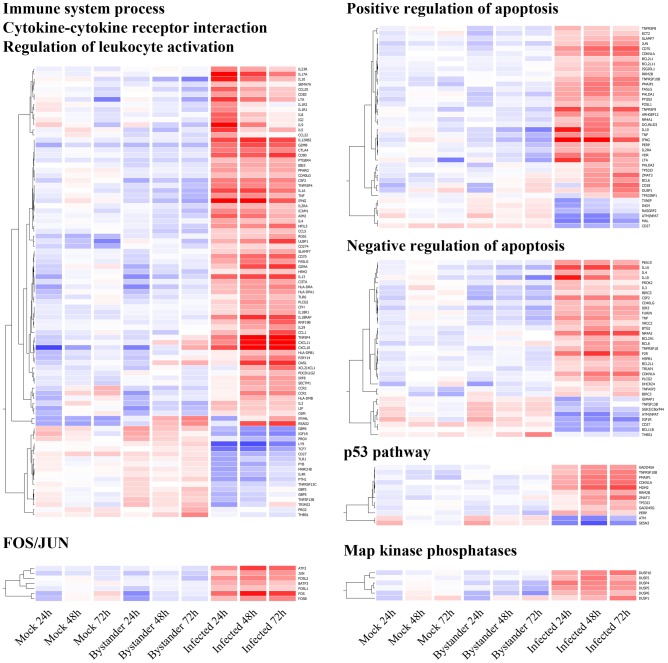
Figure 3. Gene Ontology overrepresentation analysis of genes differentially expressed in HIV-1-infected cells.
Unsupervised hierarchical clustering (per gene) of statistically over-represented Gene Ontology & KEGG pathway categories according to DAVID analysis. Since the first three categories (Immune system process – p = 1.9×10⁻¹⁷, Cytokine-cytokine receptor interaction – p 1×10⁻²⁹, Regulation of leukocyte activation – p = 1.4×10⁻⁹) overlap significantly, they are presented as a single cluster. Positive and negative regulation of apoptosis (p = 5.8×10⁻⁷ and 6×10⁻⁶, respectively) are both part of the Regulation of apoptosis category, but are here presented separately to better illustrate the absence of trend, in either direction. FOS/JUN (p = 2.3×10⁻⁵), the p53 pathway (p = 2.2×10⁻⁶) and Map kinase phosphatase (p = 2.3×10⁻⁵) are also identified as being over-represented and have implication for HIV-1 biology. All p-values mentioned above are corrected for multiple testing according to Bonferroni. The same color scale as Figure 2 applies.

