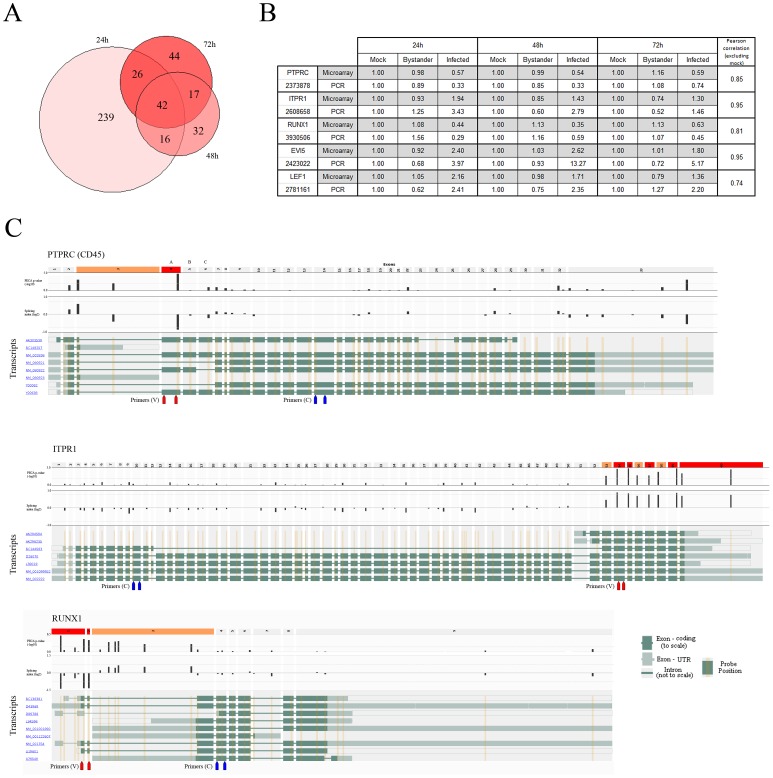
Figure 5. Alternative splicing events are found in HIV-1-infected cells.
A) Proportional Venn diagram of the number of splicing events identified in virus-infected cells versus uninfected bystander cell populations at 24, 48 and 72 h post-infection. B) Confirmation by qRT-PCR of splicing events of interest. Pearson correlation coefficients indicate that the level of similarity between qRT-PCR quantification and microarrays is very high for all studied candidates. C) Overlay of the PECA-SI algorithm p-values and the splicing index (from aggregate comparisons) for each probeset on Affymetrix Exon arrays on a representation of selected genes in their genomic context. The exons that pass both filters (p-value and fold change – dotted line on their respective plots) are coloured red and those that pass only one filter colored orange. Red and blue arrow pairs represent primer sets used for qRT-PCR confirmation of splicing events (see above). PCR primers for confirmation of splicing events are also displayed (red – variable region between isoforms, blue – constant region). Top panel: PTPRC, better known as CD45, was selected as a target to validate our approach and filtering strategy, as CD45RO memory cells are more prone to be productively infected by HIV-1. Exon 4 is the one associated with the RA variant predominant in naïve cells. Middle panel: ITPR1, which plays a role in lymphocyte activation. Bottom panel: RUNX1 (AML1/EVI1), which is a master regulator of hematopoietic development important for T cell differentiation [46] and is known to have multiple isoforms arising from alternative promoter usage [47].

