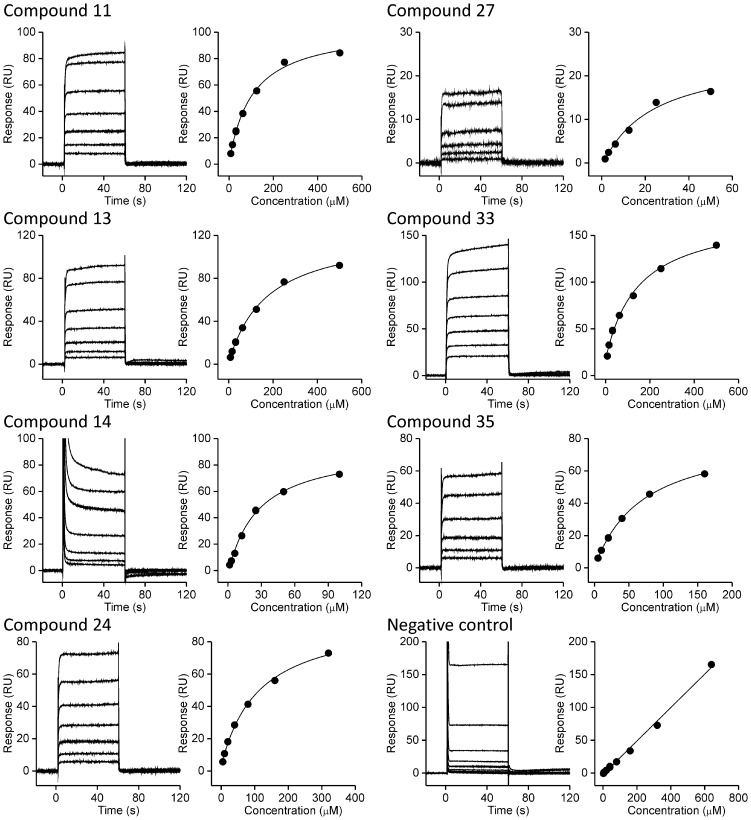
Figure 10. SPR analysis of compounds binding to DdlB.
Different concentrations of compounds were tested for the binding (left panels in all cases). The binding curves (right panels) were generated by ploting steady-state response levels, i.e. at the end of the association phase, vs concentration of the injected compound. The KDs were obtained from fitting the data to the steady-state affinity model and are reported in Table 1. For each compound 3–5 independent titrations were performed.

