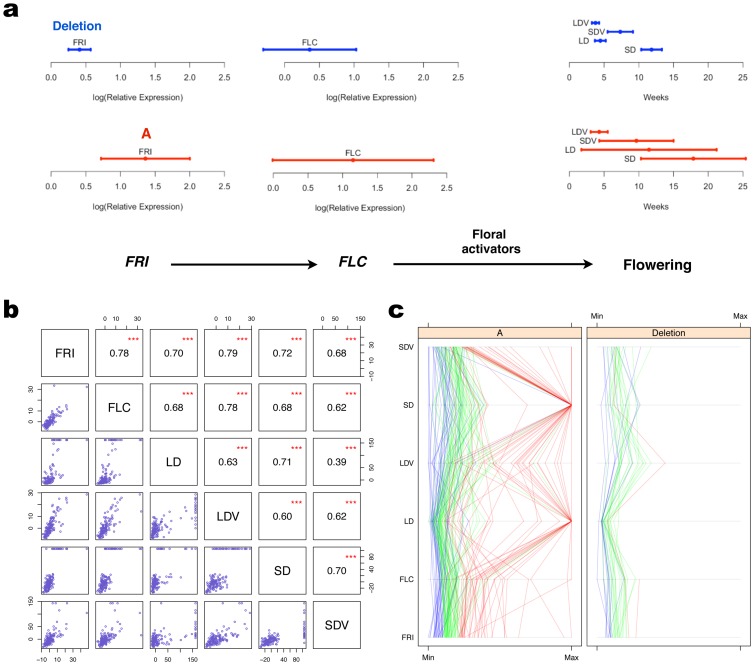
Figure 5. Propagation of variance heterogeneity in the FRI-FLC pathway.
a: The horizontal bars show the variance in FRI-expression, FLC-expression and flowering times under four different conditions (short (SD)/long (LD) days, with (V) or without (−) vernalization) as the phenotypic mean +/− 1 S.D. within the two alternative genotypes at the FRI-locus. Deletion represents homozygosity for the loss of function allele and A homozygosity for the wild-type allele. The mean and the variance are significantly larger for all traits among the inbred lines with the functional A genotype (Table 2). The pathway is adapted from [37]. b: Scatterplots and Spearman's rank correlation coefficients are given for the deviation of FRI, FLC, and the flowering traits in (a) from the median of each phenotype. *** indicates that the corresponding correlation coefficient is significantly different from zero with  -value less than
  . (c): For all the phenotypes in the pathway, the values for individuals are connected by lines. The color of the line for an individual is assigned based on its level of FRI expression. Individuals with FRI expression below the 25% quantile are in blue, between the 25% and 75% quantiles in green, and above the 75% quantile in red.

