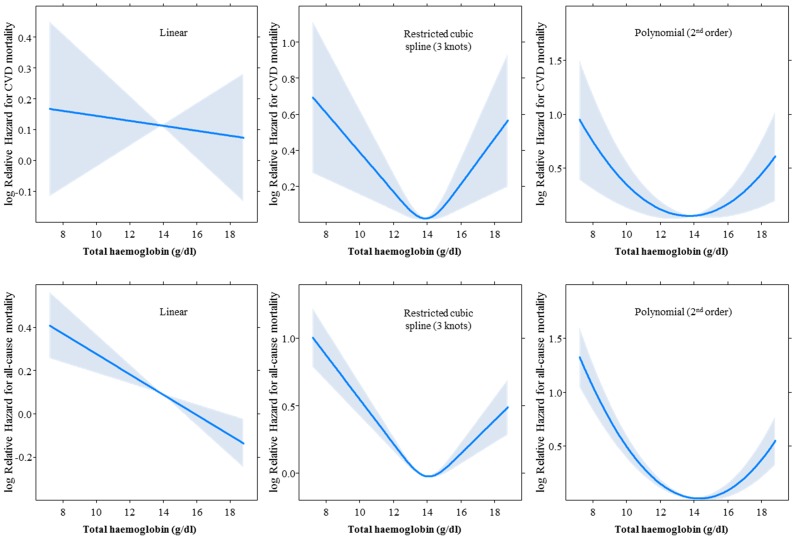
Figure 3. Effect of various coding of total haemoglobin on the association with cardiovascular disease (upper panels) and all-cause (lower panels) mortality in age, sex and cohort adjusted Cox regression models.
The solid curve depicts the shape of the shape of the association across the continuum of total haemoglobin, and the shaded area if for the 95% confidence interval around the curve.

