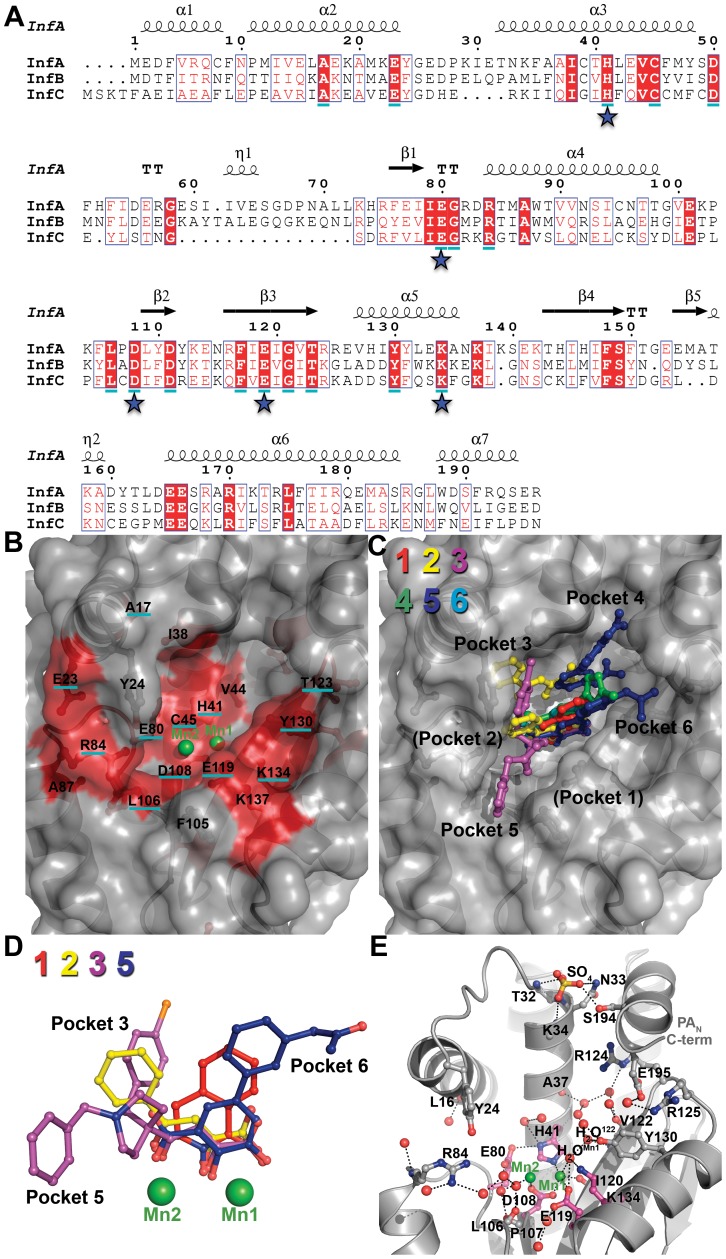
Figure 8. Conserved residues and ordered water molecules in the PAN active site cleft.
(A) Sequence alignment of PAN from influenza A, B, and C. Consensus sequences were determined from more than 13,000 sequences using the online database www.fludb.org. The secondary structure of PAN from influenza A is shown above the sequence alignment. Residues in a solid red background are identical between the influenza A, B, and C consensus sequences. Residues that are >99.9% conserved in all sequences analyzed are underlined in cyan. Stars indicate key active site residues. (B) Surface representation of the PAN ΔLoop active site cleft. Manganese ions (Mn1 and Mn2) are shown as green spheres. The highly conserved cleft is colored red. Residues that are identical between influenza A, B, and C consensus sequences are not underlined, and residues that are >99.9% conserved are underlined in cyan. (C) Surface representation of PAN ΔLoop active site cleft with overlays of compounds 1 (red), 2 (yellow), 3 (purple), 4 (green), 5 (blue), and 6 (cyan). The compounds occupy four (3–6) of the six binding pockets discussed in the text. The orientation and depicted surface are identical to those shown in panel B. (D) Superposition of bound compounds 1, 2, 3 and 5 (same coloring as panel C) after structural alignment of the entire PAN ΔLoop domain. For clarity, molecules B of 2 and 5 are not shown. Also not shown for clarity are compounds 4 and 6 because their metal-binding scaffolds overlay perfectly with 5. Manganese ions (Mn1 and Mn2) are shown as green spheres. (E) Ordered water molecules found in at least three of the four molecules in the crystallographic asymmetric unit are shown as red spheres. PAN ΔLoop is shown as gray cartoon. Manganese ions (Mn1 and Mn2) are shown as green spheres. Key active site residues are shown in magenta carbon atoms and other residues interacting with the compound or discussed in the text are shown in gray carbon atoms. A sulfate ion is shown as ball-and-stick and colored yellow (sulfur) and red (oxygen). This sulfate is bound at the same location as a predicted phosphate group of nucleic acid in a model of the PAN-substrate complex [25]. Black dotted lines represent molecular interactions less than 3.2 Å away.

