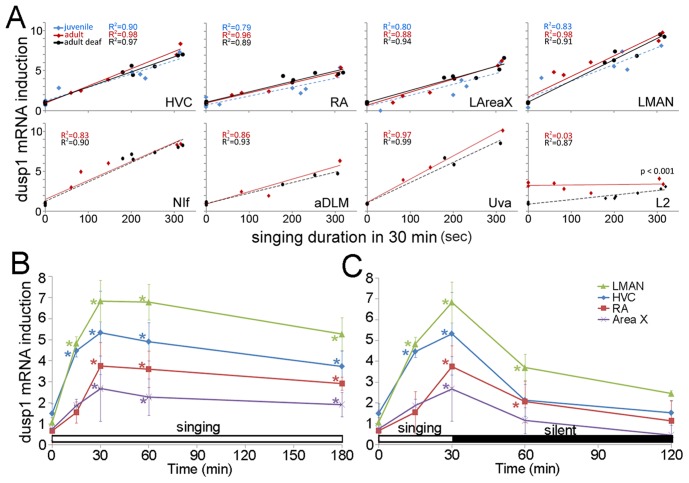
Figure 4. Temporal dynamics and auditory-feedback independence of singing-induced dusp1 expression.
(A) Expression of dusp1 mRNA in intact adult (n = 5), deafened adult (n = 6), and juvenile subsong (n = 5) singers in seven song nuclei (HVC, RA, NIf, LMAN, LAreaX, aDLM and Uva) and an auditory area (L2). Values were normalized by the average value in the same area of silent control animals of each group (n = 3 each). Due to their small size, fewer singing samples were located for Uva (n = 3 each group) and aDLM (n = 3 each group). Lines represent the best fit of the data analyzed by simple regression (R2 and p-values, upper left). Only L2 showed a difference in intact and deaf animals (p<value, lower right, multiple regression). (B) Time course of continuous singing-induced dusp1 expression in birds that sang for various times, normalized to the average of silent controls (0 min). (C) Time course of discontinuous acute singing, where singing was stopped at 30 min. There was an overall difference among time points (p<0.001 in B and p<0.001 in C, repeated measures ANOVA), *p<0.05, Dunnett’s post test of each singing time point relative to silent controls (0 min). Values are averages ±SD.

