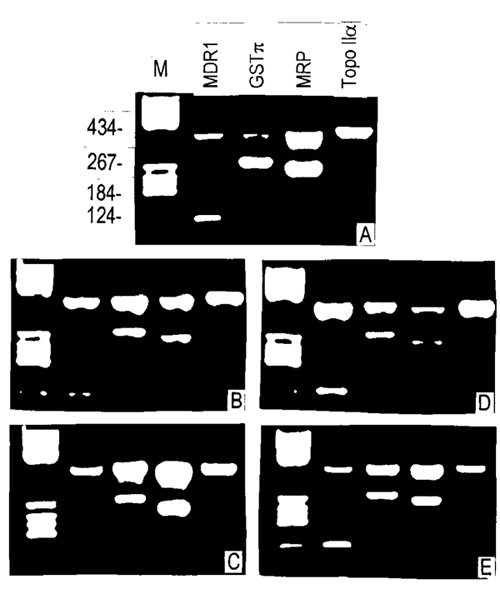
Figure 3.

Reverse transcriptase polymerase chain reaction (RT-PCR) analysis of MDR-related gene mRNA expression in NOM-pretreated MCF-7/ADR cells, amplifying β-actin (as endogenous control) with MDR1, GSTπ, MRP and TopoIIα. Lane M, DNA molecular weight marker standards (bases). The sizes of the specific RT-PCR products were 120 base pairs (bp) for MDR, 270 bp for GSTπ, 256 bp for MRP, 139 bp for TopoIIα and 383 bp for β-actin. The cell line was treated with NOM at the start (A) (control) and after 2 days (B), 3 days (C), 5 days (D) and 10 days (E).
